|
|
|
|
An unpaired electron can move between the two energy
levels by either absorbing or emitting a photon of energy  such that the
resonance condition, such that the
resonance condition,  , is obeyed. This leads to the fundamental equation of EPR
spectroscopy: , is obeyed. This leads to the fundamental equation of EPR
spectroscopy:  . .
Experimentally, this equation permits a large combination
of frequency and magnetic field values, but the great majority of EPR
measurements are made with microwaves in the 9000–10000 MHz (9–10 GHz) region,
with fields corresponding to about 3500 G (0.35 T). Furthermore, EPR
spectra can be generated by either varying the photon frequency incident on a
sample while holding the magnetic field constant or doing the reverse. In
practice, it is usually the frequency that is kept fixed. A collection of paramagnetic centers,
such as free radicals, is exposed to microwaves at a fixed frequency. By
increasing an external magnetic field, the gap between the  and and  energy states is
widened until it matches the energy of the microwaves, as represented by the
double arrow in the diagram above. At this point the unpaired electrons can move
between their two spin states. Since there typically are more electrons in the
lower state, due to the Maxwell–Boltzmann distribution (see below), there is a
net absorption of energy, and it is this absorption that is monitored and
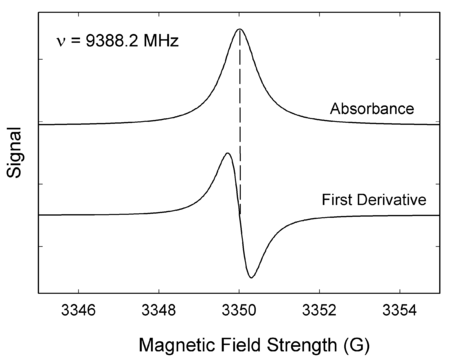
converted into a spectrum. The upper spectrum below is the simulated absorption
for a system of free electrons in a varying magnetic field. The lower spectrum
is the first derivative of the absorption spectrum. The latter is the most
common way to record and publish continuous wave EPR spectra. energy states is
widened until it matches the energy of the microwaves, as represented by the
double arrow in the diagram above. At this point the unpaired electrons can move
between their two spin states. Since there typically are more electrons in the
lower state, due to the Maxwell–Boltzmann distribution (see below), there is a
net absorption of energy, and it is this absorption that is monitored and
converted into a spectrum. The upper spectrum below is the simulated absorption
for a system of free electrons in a varying magnetic field. The lower spectrum
is the first derivative of the absorption spectrum. The latter is the most
common way to record and publish continuous wave EPR spectra.
|
|
Bench-top ESR Spectrometer:
Miniature electron spin resonance spectroscopy with Micro-ESR
https://en.wikipedia.org/wiki/Electron_paramagnetic_resonance#Miniature_electron_spin_resonance_spectroscopy_with_Micro-ESR
-
Miniaturisation of military radar technologies allowed the development of
miniature microwave electronics as a spin-off by the California
Institute of Technology.
Since 2007 these sensors have been employed in miniaturized electron spin
resonance spectrometers called Micro-ESR. Applications include real-time
monitoring of free radical containing asphaltenes in
(crude) oils, biomedical R&D to measure oxidative stress, evaluation of the
shelf life of food products.[citation
needed]
|
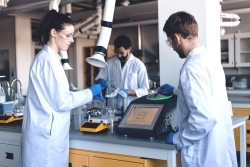
Bench-top ESR Spectrometer
|
- |
|
Applications:
https://en.wikipedia.org/wiki/Electron_paramagnetic_resonance#Applications
EPR/ESR spectroscopy is used in various branches of science, such as biology, chemistry and physics, for the detection and
identification of free radicals and
paramagnetic centers such as F-centers. EPR is a
sensitive, specific method for studying both radicals formed in chemical
reactions and the reactions themselves. For example, when ice (solid H2O) is decomposed by exposure to high-energy radiation,
radicals such as H, OH, and HO2 are produced. Such
radicals can be identified and studied by EPR. Organic and inorganic radicals
can be detected in electrochemical systems and in materials exposed to UV light. In many
cases, the reactions to make the radicals and the subsequent reactions of the
radicals are of interest, while in other cases EPR is used to provide
information on a radical's geometry and the orbital of the unpaired electron.
EPR/ESR spectroscopy is also used in geology and archaeology as a dating tool.
It can be applied to a wide range of materials such as carbonates, sulfates,
phosphates, silica or other silicates.[11]
Medical and biological applications
of EPR also exist. Although radicals are very reactive, and so do not normally
occur in high concentrations in biology, special reagents have been developed to
spin-label molecules of interest. These reagents are particularly useful in
biological systems. Specially-designed nonreactive radical molecules can attach
to specific sites in a biological cell, and
EPR spectra can then give information on the environment of these so-called spin labels or spin probes. Spin-labeled
fatty acids have been extensively used to study dynamic organisation of lipids
in biological membranes,[12] lipid-protein interactions[13] and temperature of transition of gel to liquid crystalline
phases.[14]
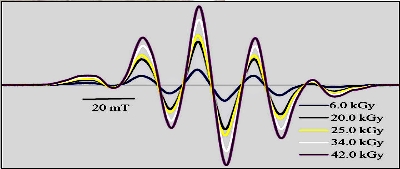
A type of dosimetry system has
been designed for reference standards and routine use in medicine, based on EPR
signals of radicals from irradiated polycrystalline α-alanine (the
alanine deamination radical, the hydrogen abstraction radical, and the (CO−(OH))=C(CH3)NH2+ radical) . This method is suitable for measuring gamma and x-rays, electrons, protons, and
high-linear energy
transfer (LET) radiation of doses in
the 1 Gyto 100 kGy range.[15]
EPR/ESR spectroscopy can be applied only to systems in which the balance between
radical decay and radical formation keeps the free radicals concentration above
the detection limit of the spectrometer used. This can be a particularly severe
problem in studying reactions in liquids. An alternative approach is to slow
down reactions by studying samples held at cryogenic temperatures,
such as 77 K (liquid nitrogen) or
4.2 K (liquid helium). An
example of this work is the study of radical reactions in single crystals of
amino acids exposed to x-rays, work that sometimes leads to activation energies and
rate constants for radical reactions.
The study of radiation-induced free radicals in biological substances (for
cancer research) poses the additional problem that tissue contains water, and
water (due to its electric dipole
moment) has a strong absorption band in the microwave region
used in EPR spectrometers.
EPR/ESR also has been used by archaeologists for the
dating of teeth. Radiation damage over long periods of time creates free
radicals in tooth enamel, which can then be examined by EPR and, after proper
calibration, dated. Alternatively, material extracted from the teeth of people
during dental procedures can be used to quantify their cumulative exposure to
ionizing radiation. People exposed to radiation from the Chernobyl disasterhave
been examined by this method.[16][17]
Radiation-sterilized foods have been examined with EPR spectroscopy, the aim
being to develop methods to determine whether a particular food sample has been
irradiated and to what dose.
Because of its high sensitivity, EPR was used recently to
measure the quantity of energy used locally during a mechanochemical milling
process.[18]
EPR/ESR spectroscopy has been used to measure properties of crude oil, in particular asphaltene and vanadium content.
EPR measurement of asphaltene content is a function of spin density and solvent
polarity. Prior work dating to the 1960s has demonstrated the ability to measure
vanadium content to sub-ppm levels.
In the field of quantum computing, pulsed EPR is
used to control the state of electron spin qubits in materials
such as diamond, silicon and gallium arsenide.
|
EPR/ESR and its Applications
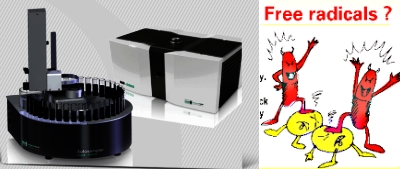
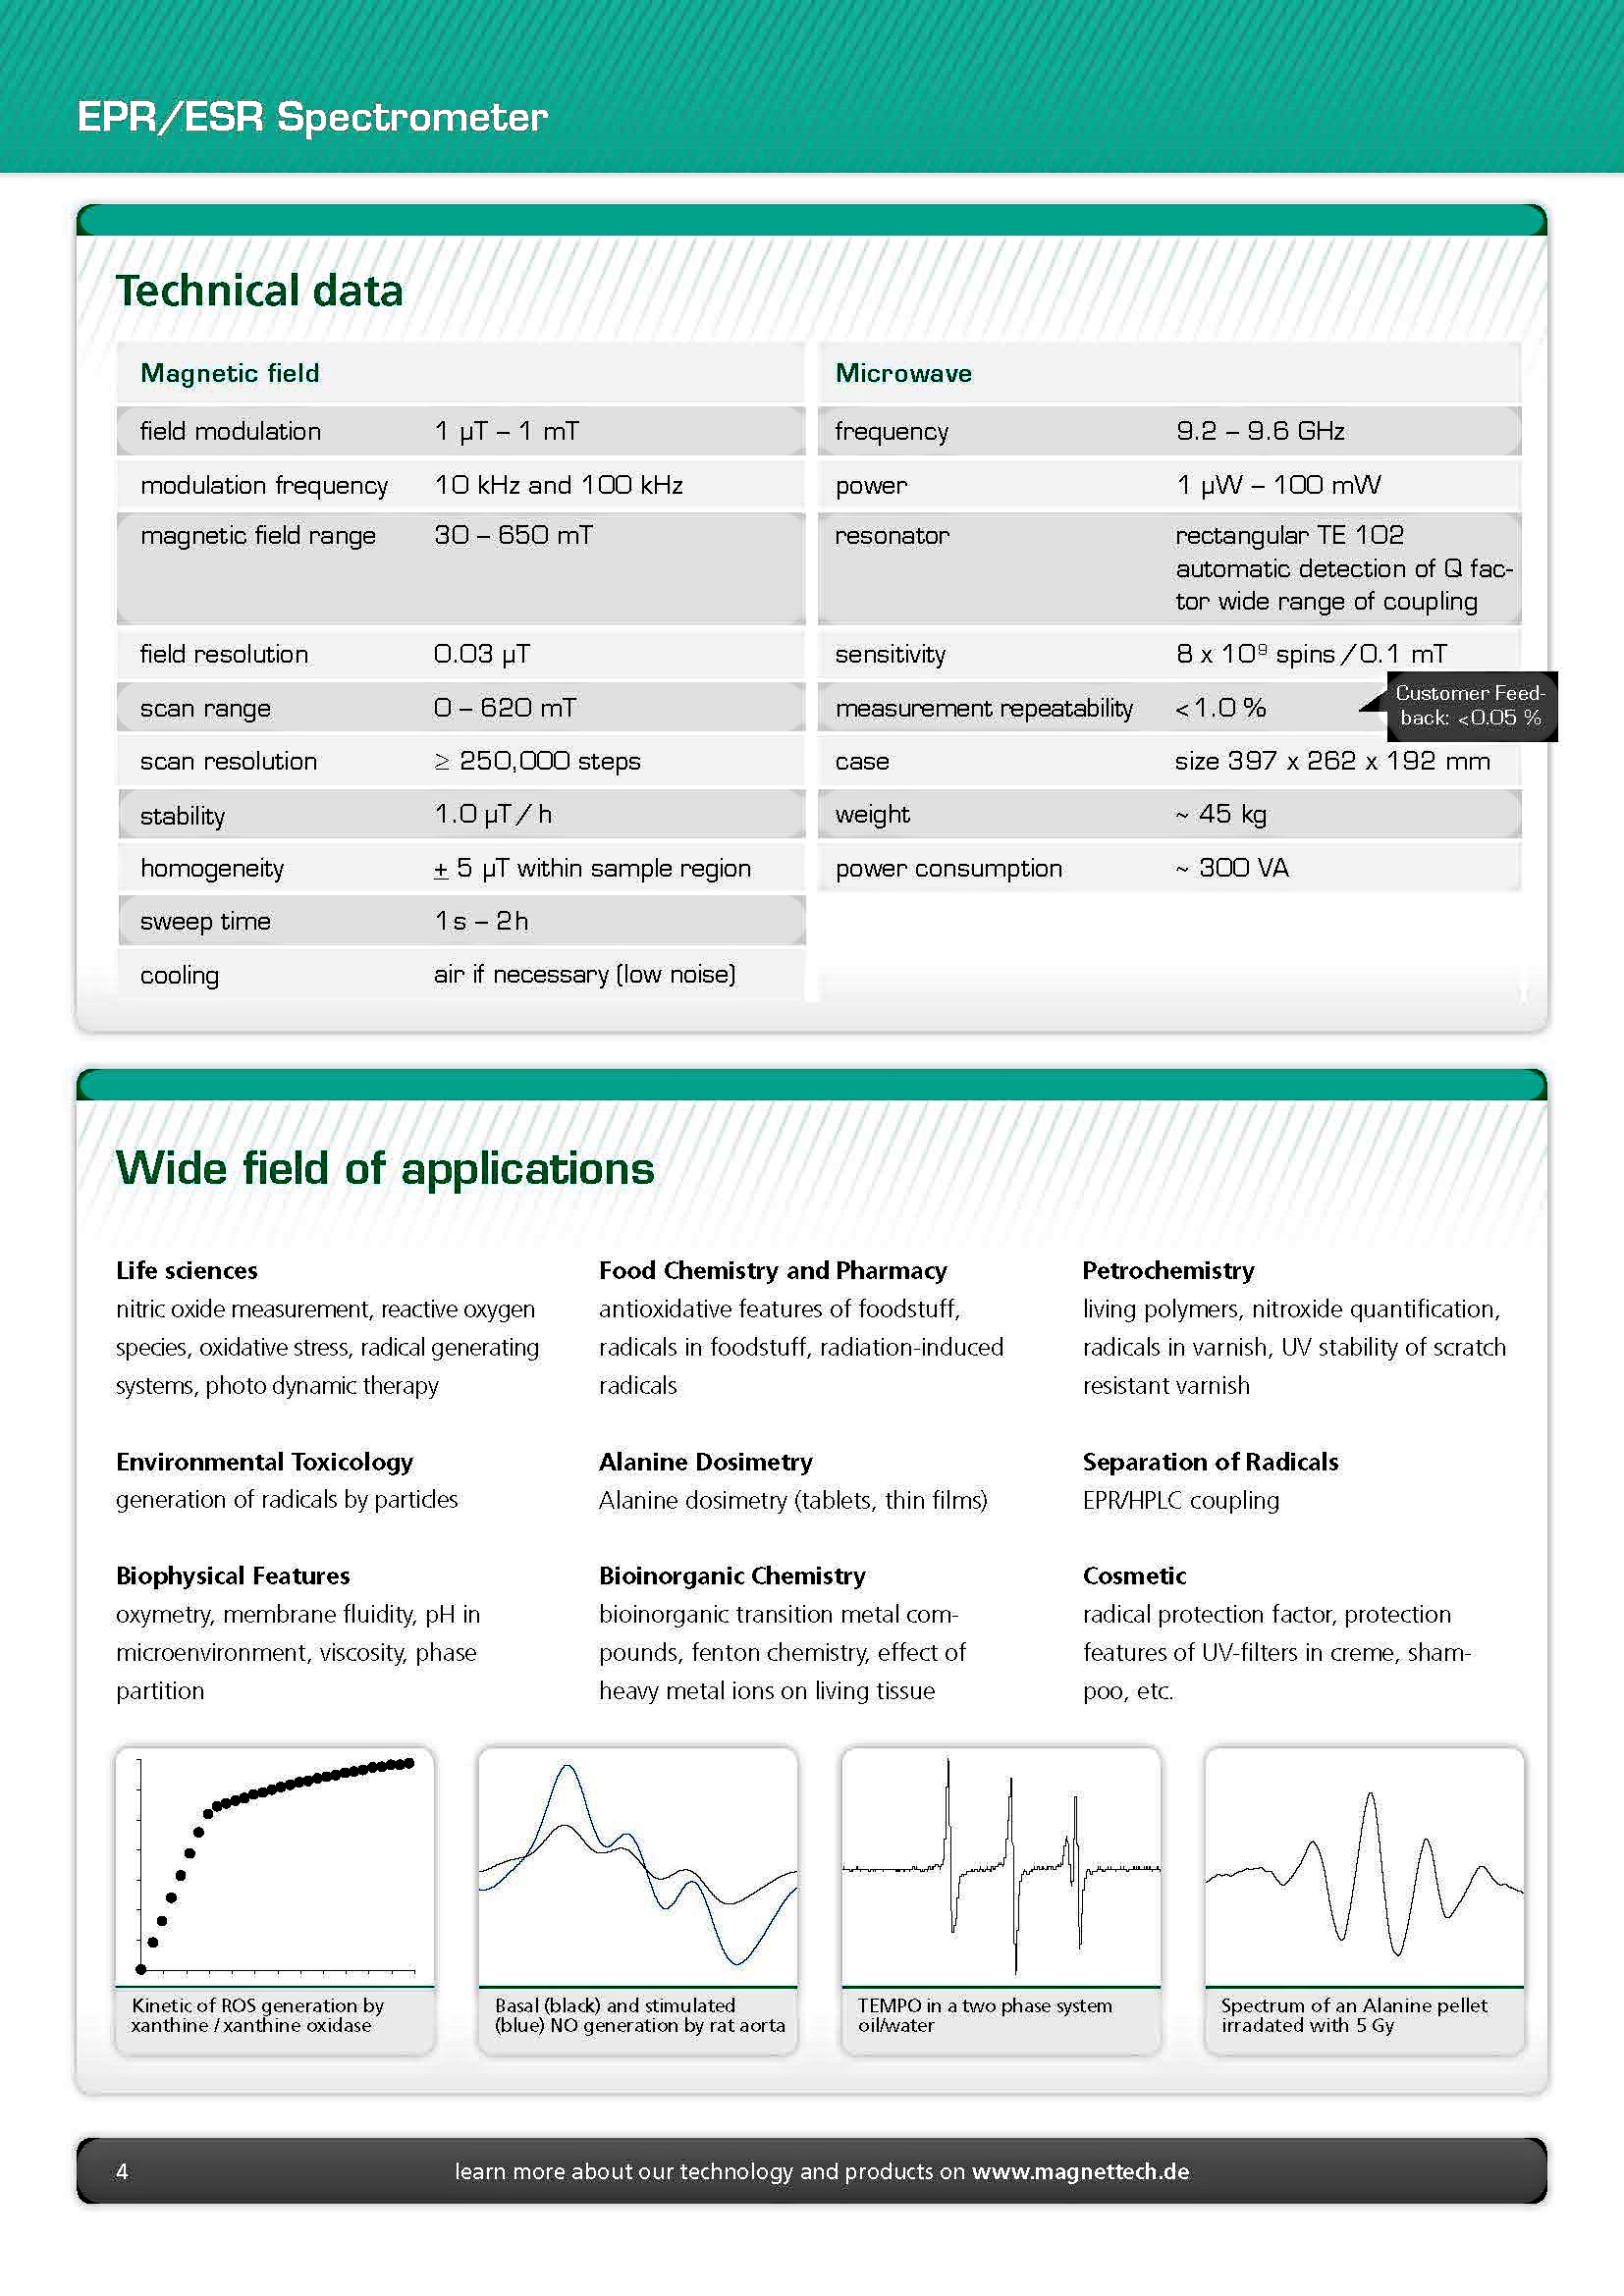
EPR is the only method for the direct detection of paramagnetic species. EPR/ESR
spectroscopy has wide field of applications from Research & Development to
Quality control in branches.
|
|

|
|

|
|
Alanine
dosimetry
Industry standard for evaluating irradiation doses on alanine tablets |
|
Life sciences
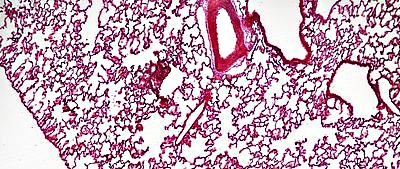
Nitric oxide measurement, reactive oxygen species, oxidative stress, radical
generating systems, photo dynamic therapy
|
|
Food
safety and quality
Antioxidative features of foodstuff, radicals on foodstuff, radiation-induced
radicals |
|
|
|
|
|
|
|
|

|
|

|
|
|
|
Petrochemistry
Living polymers, nitroxide quantification, radicals in varnish, UV stability of
scratch resistant varnish
|
|
Environmental chemistry
Variety of free radicals in environmental applications can be evaluated by EPR
spectroscopy |
|
Solid
state physics
Analysis of chemical structure of paramagnetic centers and their orientation
within a crystal |
|
|
|
|
|
|
|
|
|
|
|
|
|
|
Biophysical features
Oxymetry, membrane fluidity, pH in microenvironment, viscosity, phase partition. |
|
Bioinorganic chemistry
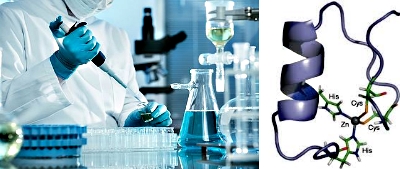
Bioinorganic transition metal compounds, fenton chemistry, effect of heavy metal
ions on livving tissue
|
|
Beer and
Beverage analysis
Beer flavor stability and shelf time evaluation |
|
|
|
|
|
|
|
|
180 Key Features of our EPR/ESR Spectrometer:
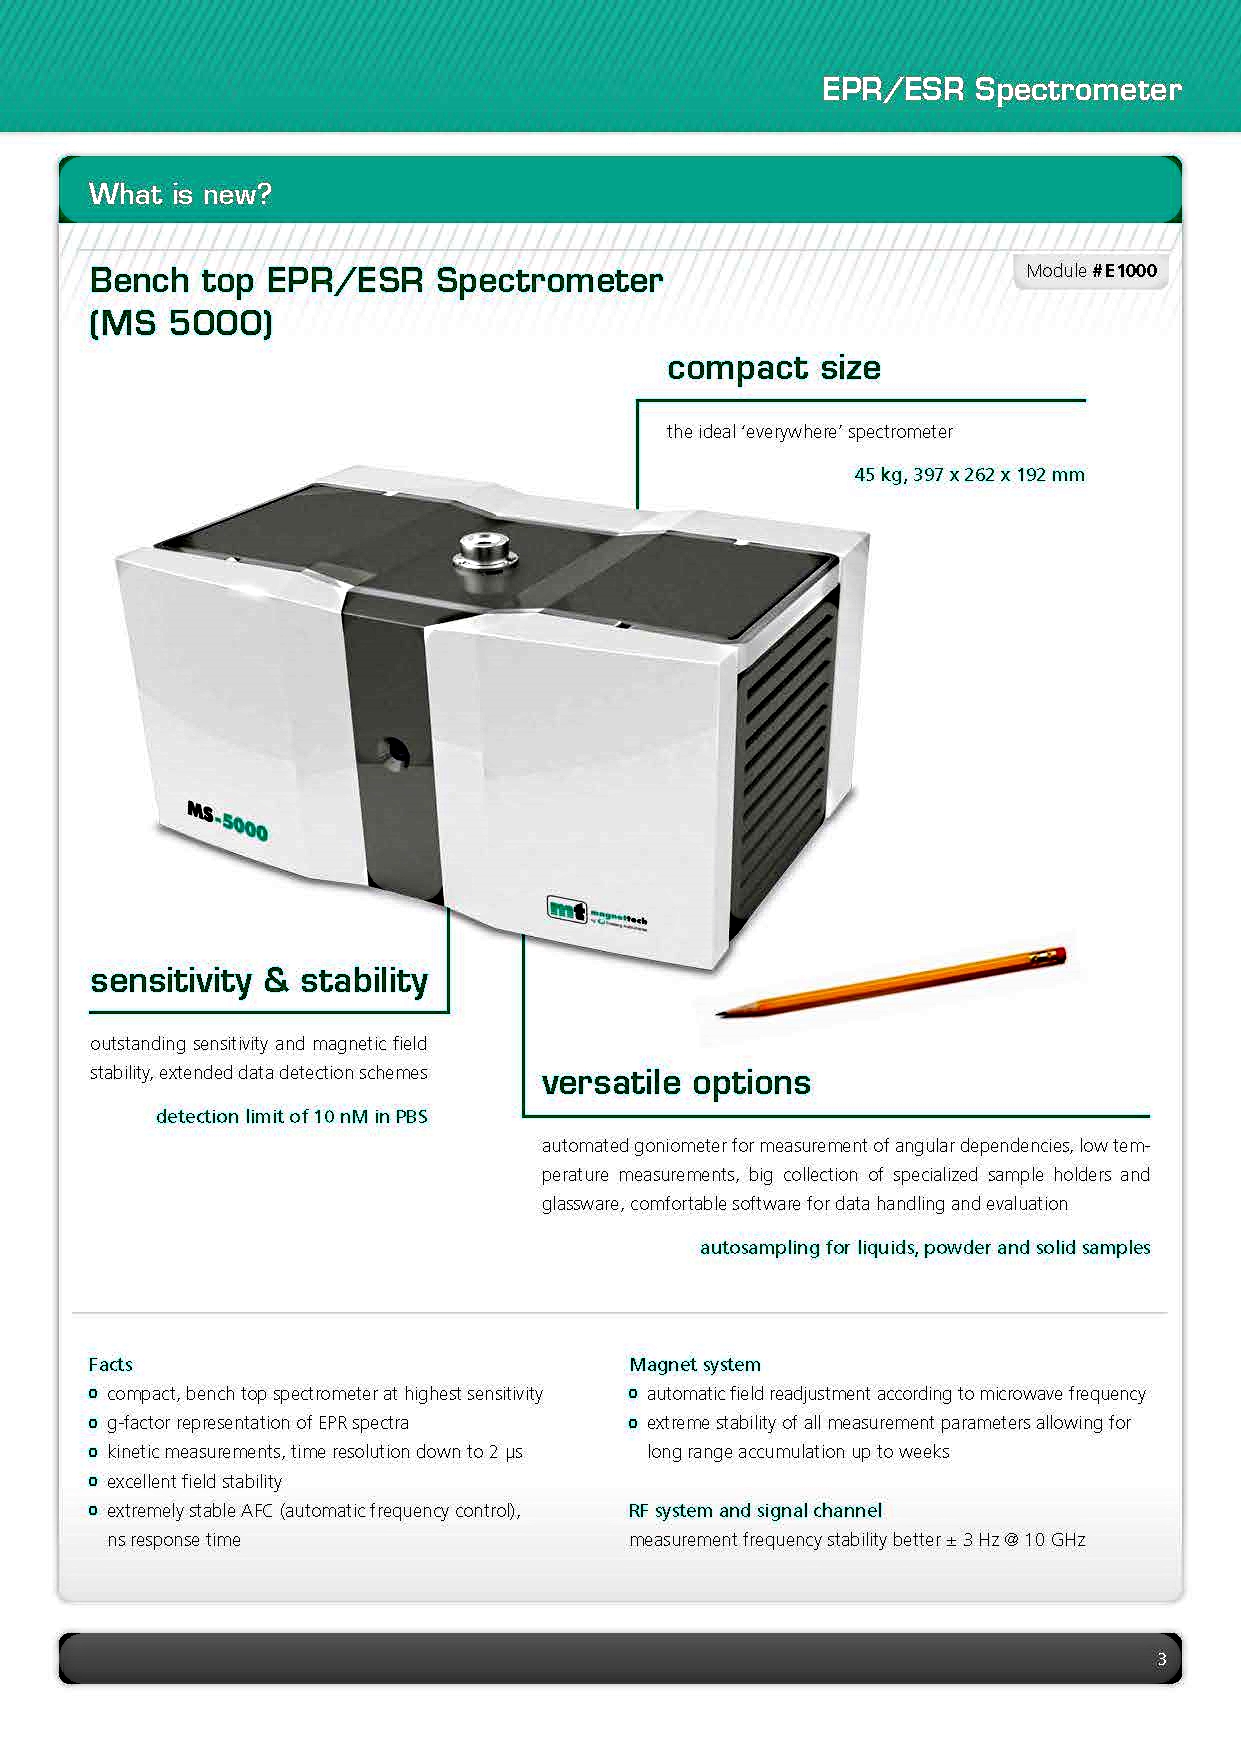
Our Benchtop ESR Spectrometer is a
Research Grade Device
with sensitivity and reliability for demanding applications in the field of ESR
spectroscopy.
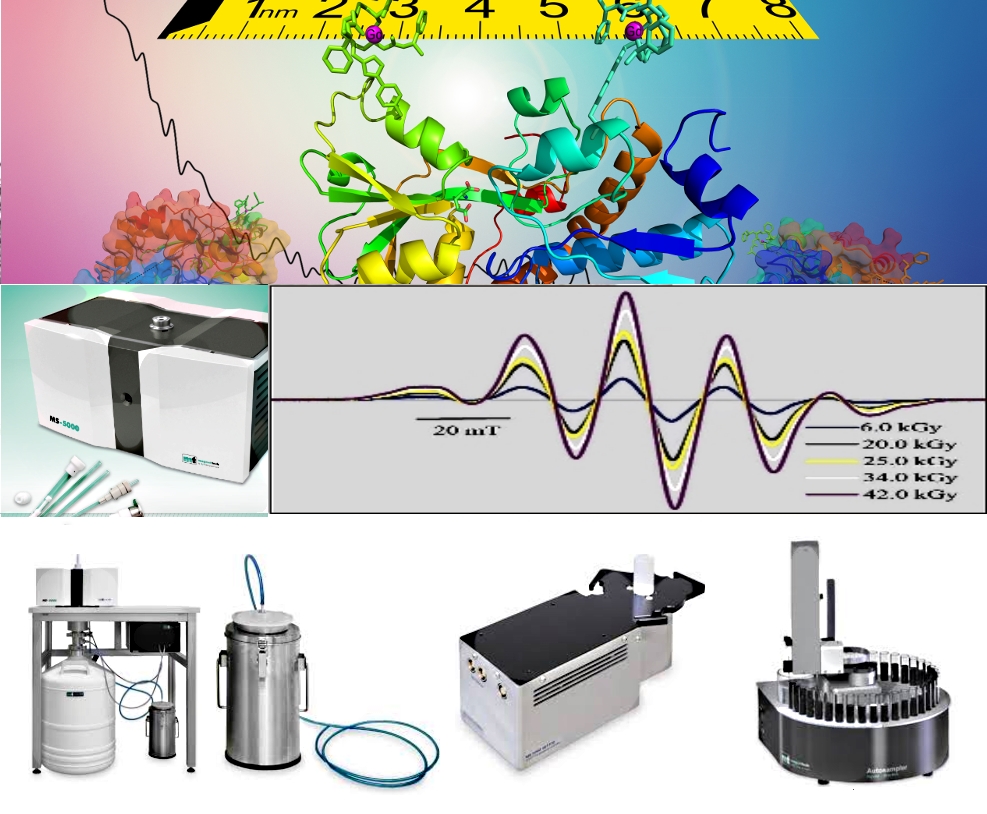
Compact size:
.The ideal everywhere’spectrometer.
.Can be handled by one person.
.Very low power consumption.
.397 x 262 x 192 mm, 45 kg
Stability and Sensitivity:
.Outstanding sensitivity and magnetic field stability.
.Extended data detection schemes.
.Higher Sensitivity than large sized EPR/ESR Spectrometers.
.Do the same job as an expensive mammoth sized ESR spectrometer.
.Modern electronic design minimizes the entire electronics to the size of a
small notebook.
.Combination of high frequency circuits for space application.
.Enable extraordinary signal to noise ratios.
.Compact high performance rectangular resonator.
.Allows for a small magnet air gap and consequently a very compact magnet
design.
.Sample size up to 8 mm is standard.
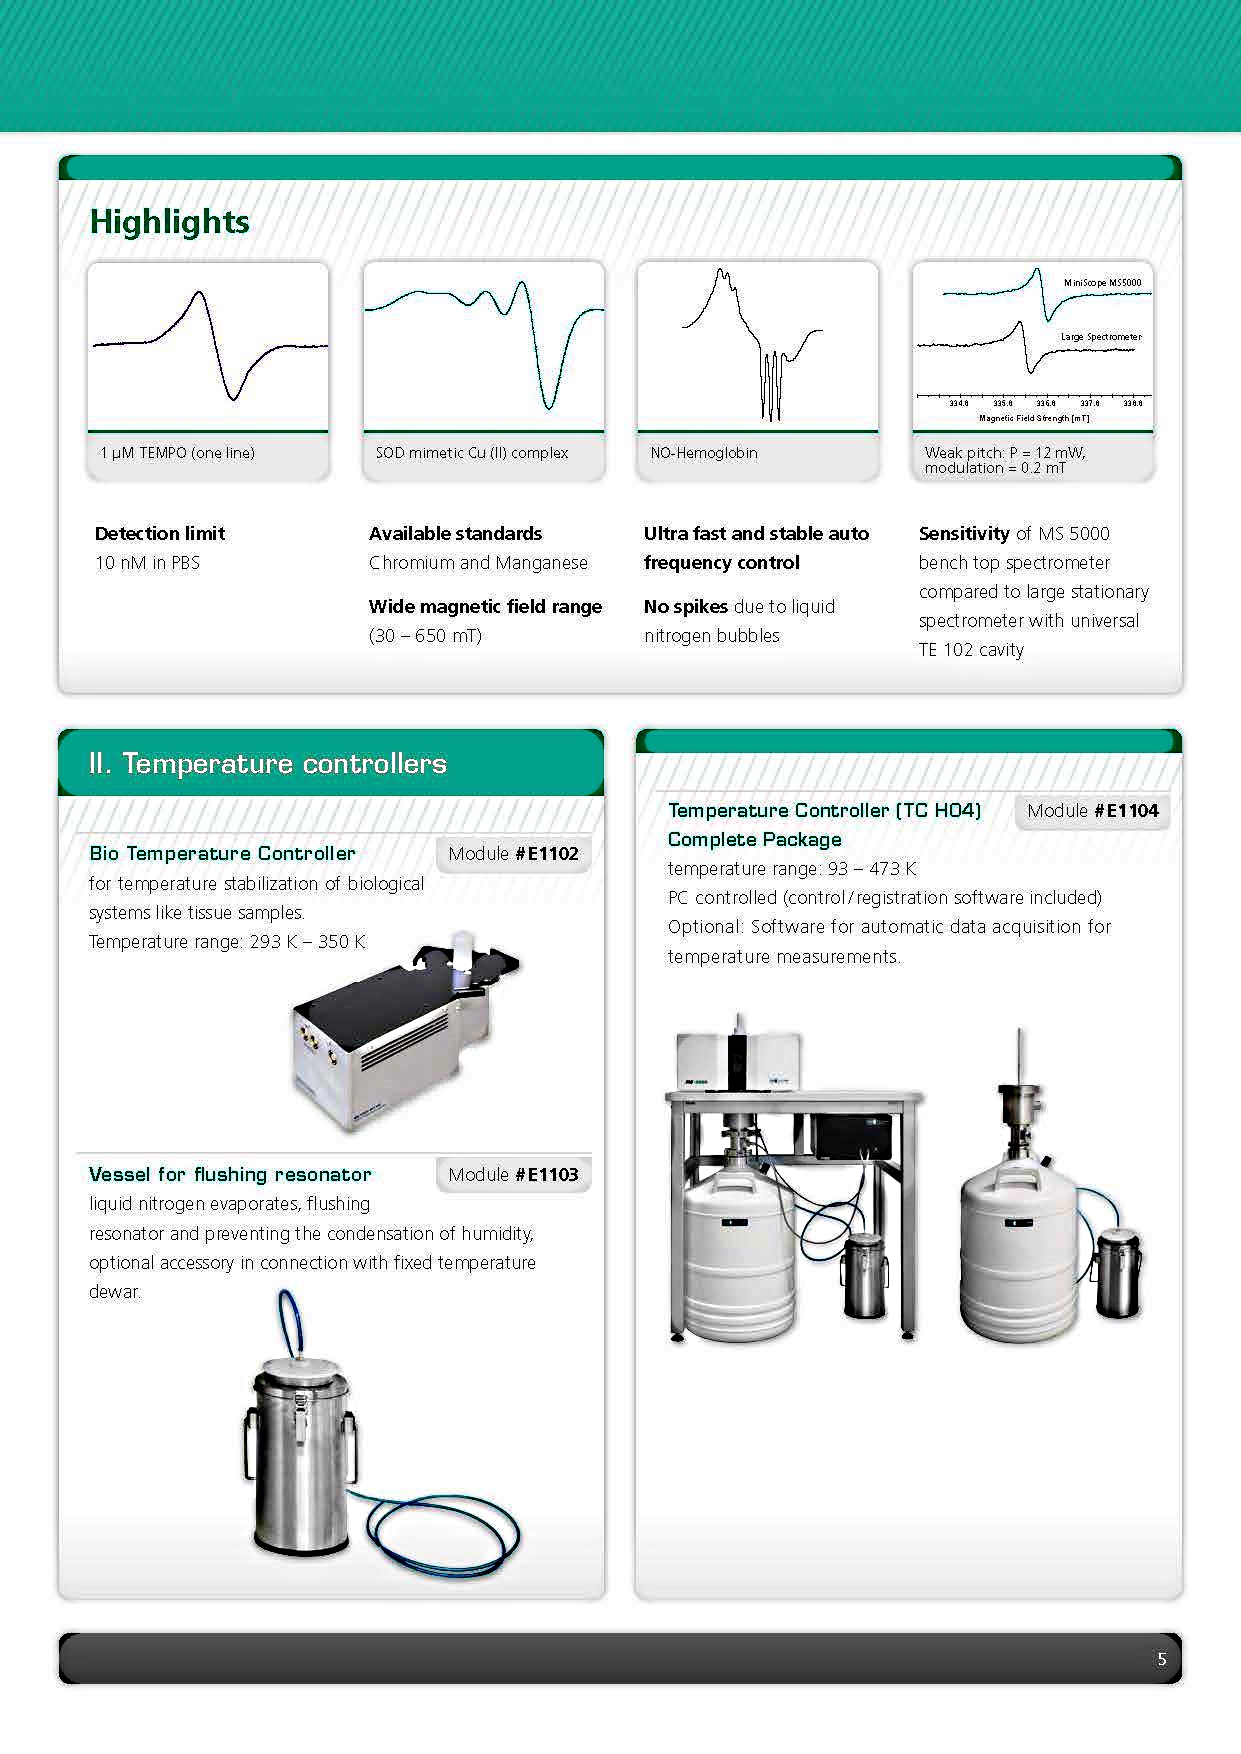
.Detection limit of 10 nM TEMPOL in water.
Versatile options:
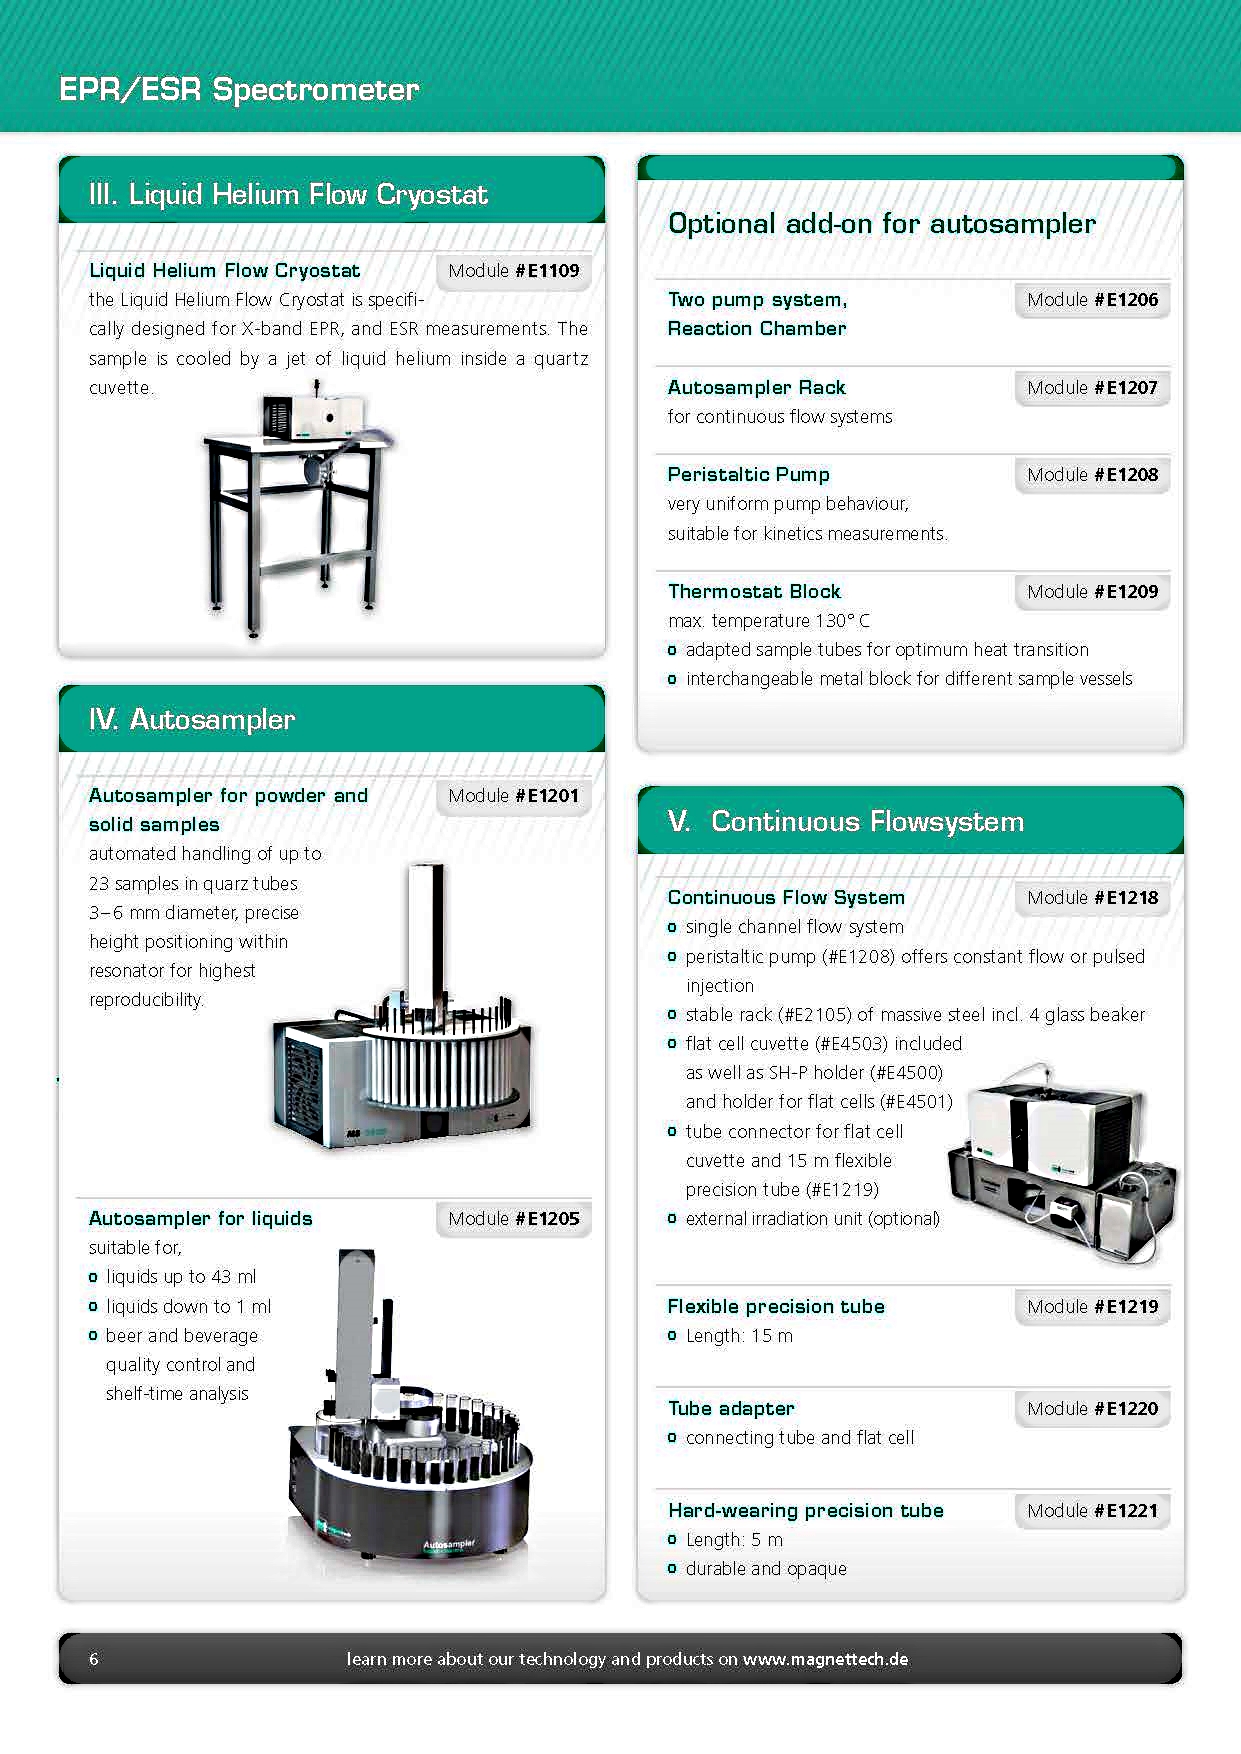
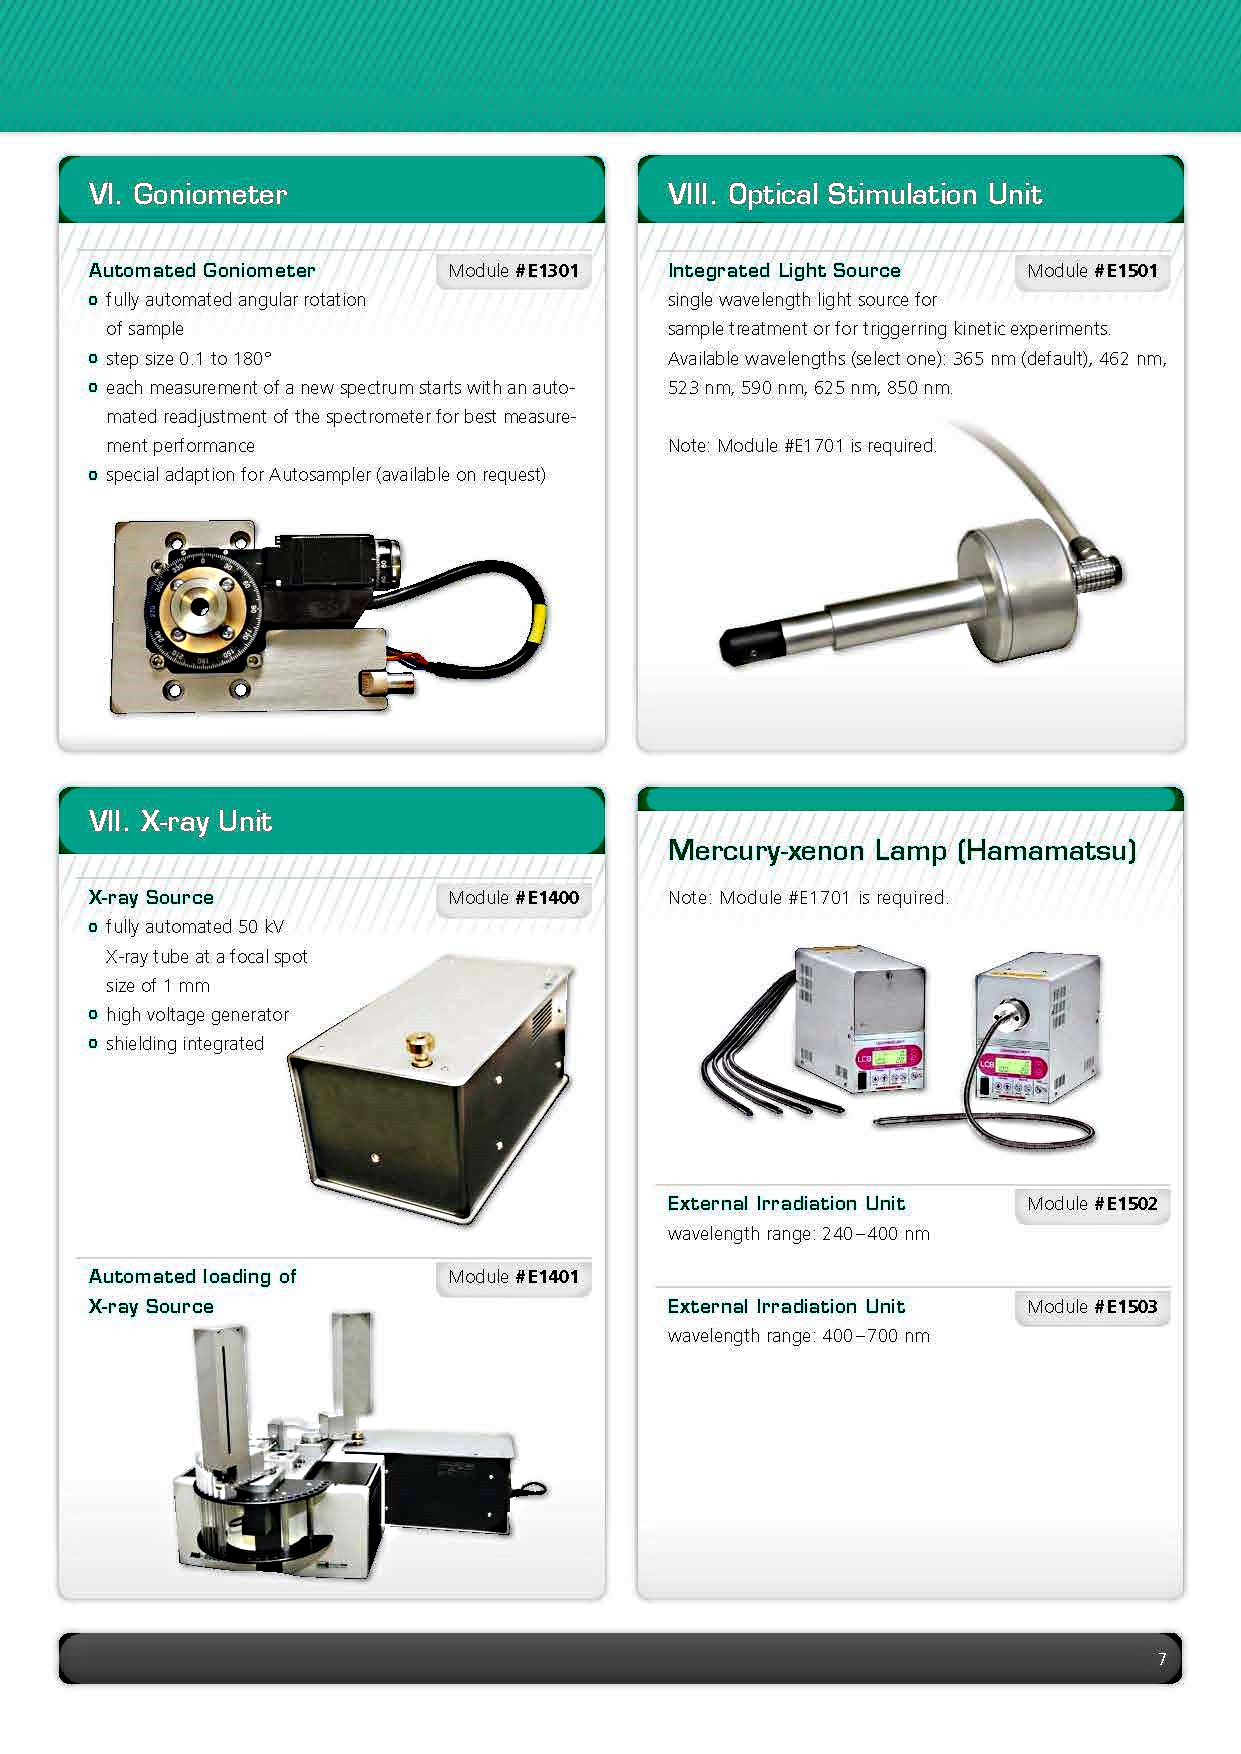
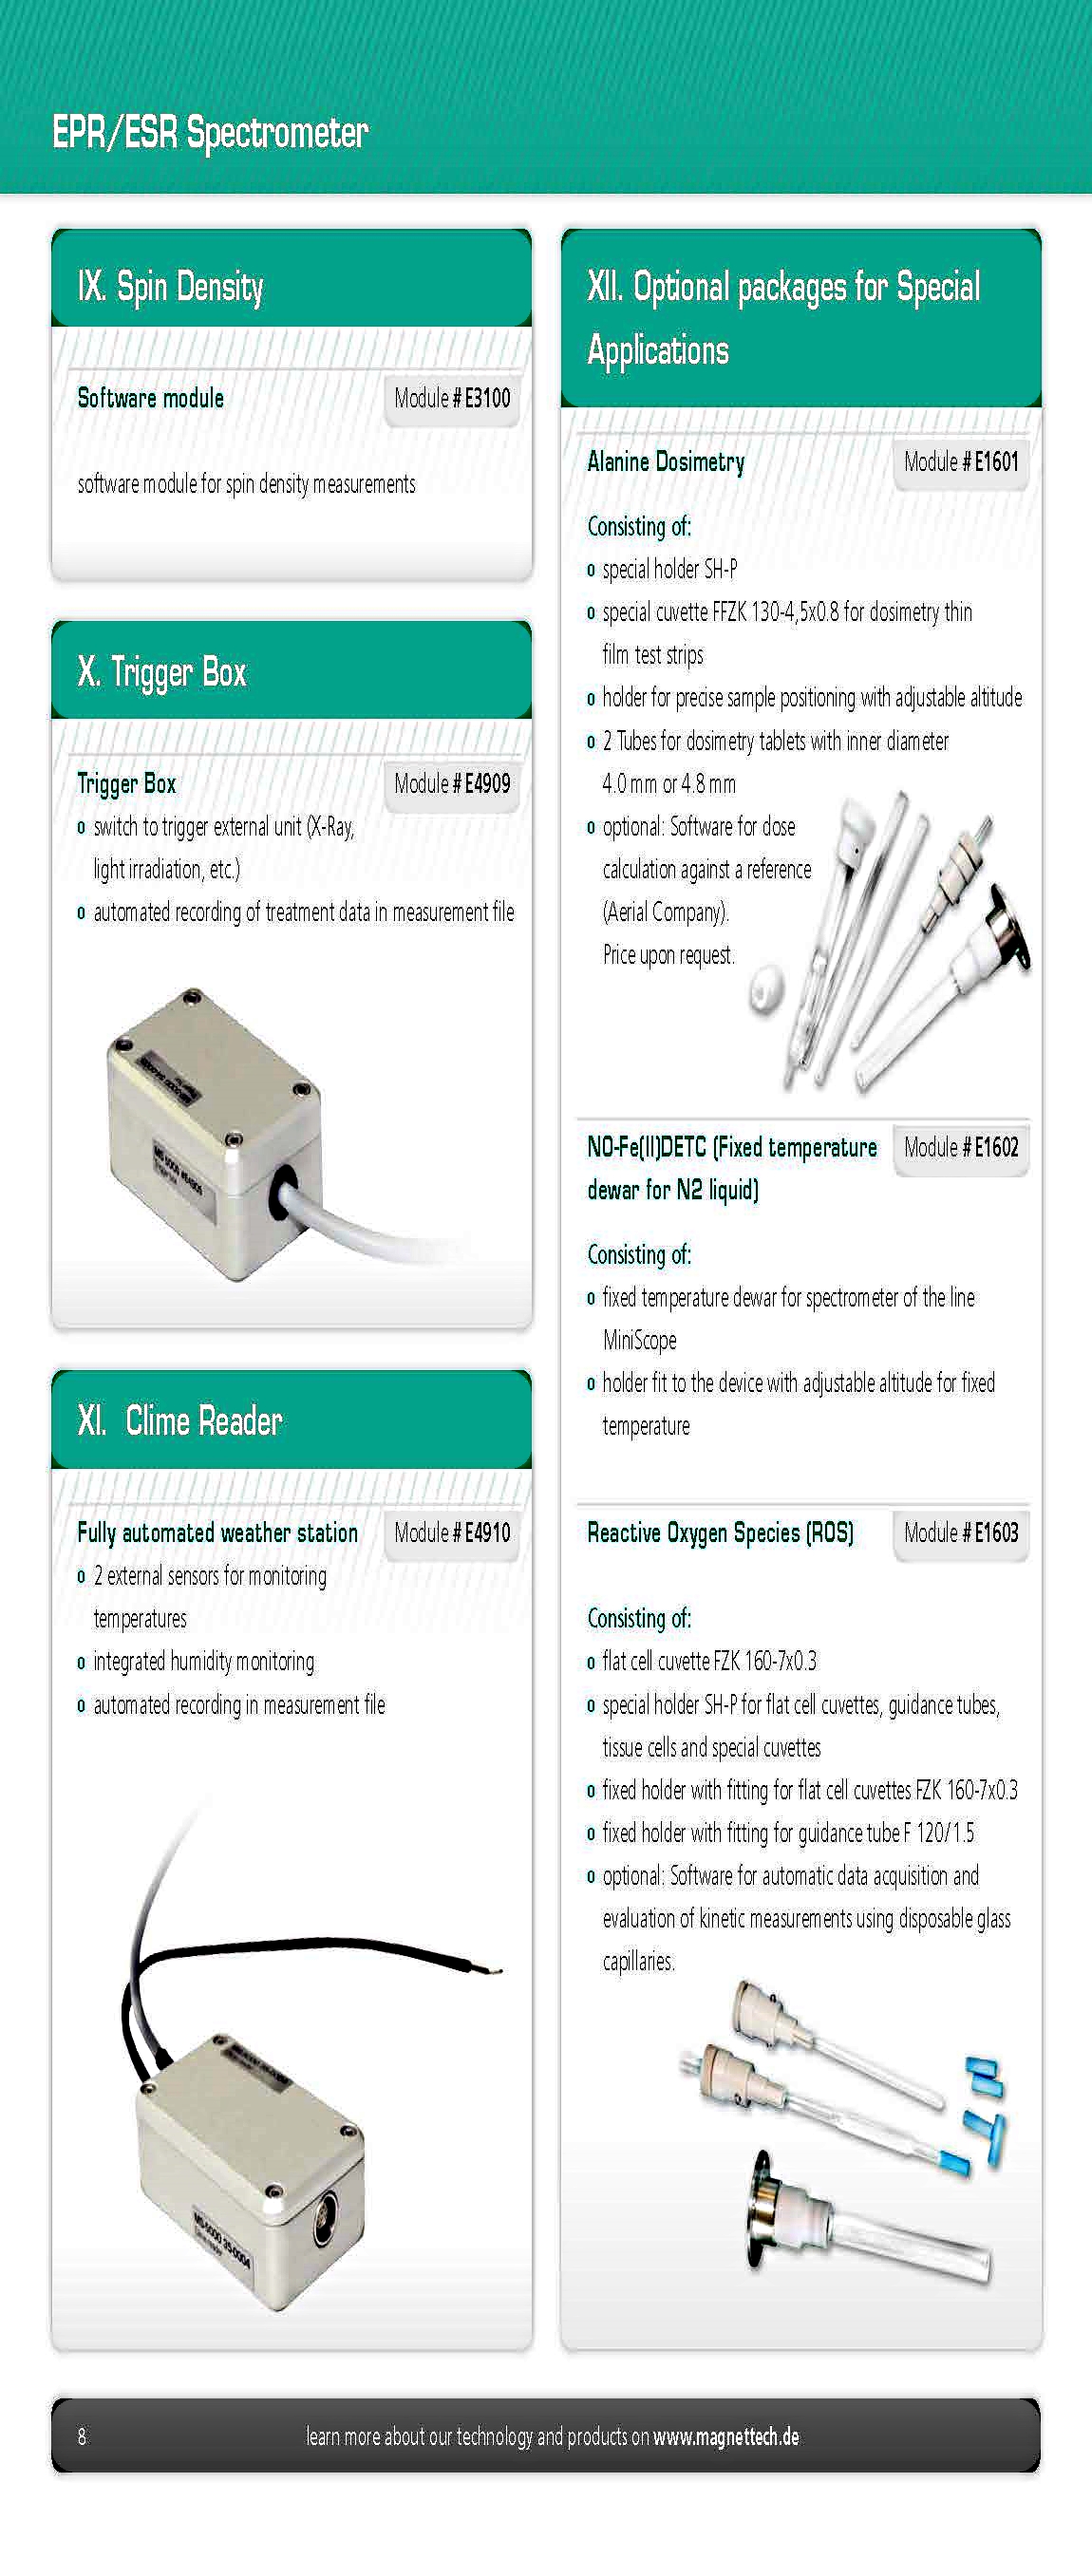
.Large collection of accessories for automization and specific measurements.
.Big collection of ESR glassware.
.Autosampling for liquids, powders and solid samples.
Mechanical and Electronics concept:
.Very compact mechanical design.
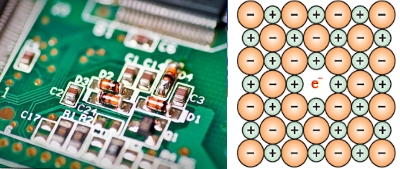
.The entire electronics is based on a few tiny high-tech PCB boards including
microwave integrated circuits.
.There is almost no wiring, resulting in high reliability.
.Easy maintenance and service and a very efficient assembly during production.
.Allowing for a high cost effectiveness.
.Extensive automatic self- test and calibration facilities.
.Easily attached accessories: All accessories such as Autosampler, Sample
cooling or heating systems, Goniometer and
others are connected by a proprietary bus system and can be easily attached to
the main ESR system at any time.
.Universal power supply: 110 V to 260 V, 50/60 Hz AC which meets world wide
safety and EMV standards.
.Low power consumption: Maximum at highest magnetic field is 200 W and the
stand-by power consumption between measurements is very low.
.Completely air- cooled, no water cooling is required.
.Modern software (ESRStudio) for spectrometer Operation and Data Evaluation.
RF System and Signal Channel:
.Saturation Enhanced ESR spectroscopy.
.ESR- signal intensities according to the individual saturation behavior of ESR-
lines.
.Greatly helps to identify individual lines in complex ESR- spectra.
.At a given microwave power and temperature, heavily saturated lines exhibit
large signals whereas unsaturated lines do not show up at all.
.Signal Channel Dynamic better than 140 db.
.Enables the detection of extremely weak lines as well as extremely strong lines
in the same spectrum.
.No "amplification factor”or similar needs to be set before the measurement.
Additional Features:
.RF frequency counter.
.Microwave power meter.
.Maximum microwave power 100 mW, 60 db attenuation range.
.Fully automated Q factor measurement of resonator.
.Ultra-fast and stable AFC, e.g. no effect of cooling liquid bubbles.
.Magnetic field modulation 100 kHz, 1 mTpp down to 1 µTpp.
.10 kHz magnetic field modulation.
.Second harmonic detection.
."DC”ESR measurements without any modulation for measurements on spin systems
with extremely long spin lattice relaxation("rapid passage measurement").
.Extremely low frequency magnetic field modulation of 5 Hz to 30 Hz for EDMR-
measurements.
.Automatic microwave-frequency re-adjustment of magnetic field, g-value
representation of ESR spectra.
.Transient measurements with time resolution down to 2 µs.
Alanine dosimetry:
.Complete Alanine-EPR Dosimetry system for routine dosimetry in industrial
irradiation facilities, or for use as an in-house alanine reference dosimetry
system.
.Highest quality measurements, with higher measurement sensitivity.
.Provides a stronger measurement response signal than any other bench-top EPR
spectrometer on the market today.
.Reduces measurement time in half from 40 seconds down to 10 seconds or less.
.More rugged, higher reliability and uptime > 99 %, using a solid-state
technology.
.Accommodates a wide variety of commercially available alanine dosimeters with
specialized holders and flexibility.
.Allows IP based remote system accessibility of operation and technical support,
from anywhere in the world.
.Straightforward and quick measurement, with Barcode scan(automatic) or Enter
sample name(Manual).
.Calculated dose is displayed and stored automatically in secured database.
.Mass of the sample optionally entered for reference.
.Very short measurement time, 10s(8000readouts/day)for High dose(0.5 up to > 200
kGy) .120s for Low dose(<1 up to 20 Gy).
.Calibrated one time in a very simple procedure with a large calibration range.
.Only a very straightforward and quick measurement routine needs to be performed
by the user.
.Glassware and optional add ons: Alanine pellets, pellet holder, blisters,
blister holder, Barcode reader, Autosampler
.Special alanine dosimetry software.
Petrochemistry:
.Petrochemistry standard techniques.
.Research sensitivities measuring vanadium and asphaltene in a few seconds
without sample preparation.
.Standard data interfaces for routine applications .
.Robust and can be integrated as an OEM unit for industrial needs.
.Automated evaluation is standard in the ESR evaluation software
.as well as predefined calibration curves for quantitative ESR measurements.
.Autosampler for high sample throughput routine applications.
Biophysical:
.High
sensitivity of MS5000 ESR/EPR spectrometer reaching down to nanomolar range.
.Continuous and classical contributes to biomolecule structure elucidation study
application in combination with autosampler.
.High sensitivity reaching down to nanomolar range.
.Optical stimulation unit consists of Integrated light source.
.Wavelength range: 240 - 700 nm.
.Other Wavelengths are available on request.
Practical examples:
.High speed kinetic option for direct detection of radiation induced radicals
down 2µs due.
.Dry alanine powder radical detection for efficient dosimetry.
.Detection of unpaired electron(radical existing only for a short period), that
is preserved(spin traps).
.Spin label probe detection for the fluidity or viscosity of the phase
environments.
.Quantification of oxygen (oximetry) through spectrum line width of a spin label
that depends on the content of molecular oxygen within the sample.
Life sciences:
.Practical examples seems to be endless:
.Elucidate fundamental life processes.
.Monitor the path of Reactive Oxygen Species e.g. nitric oxide), throughout
living organisms.
.Some examples are spin trapping applications as for nitric oxide (NO), protein
structure, fluoride or silicate investigations.
.Spin trapping of nitric oxide(NO) with iron complexes, determination of
oxidative stress, invo applications of ESR.
.Blood oxymetry Standard of Spin trapping with ESR measurement.
.Spin labelling involves extrinsic probes as nitroxide attached to the protein
or molecule under investigation.
.Protein and Enzyme mechanisms and structural elucidation of biomolecules,
specific analysis of active centers.
Environmental chemistry:
.Allows access to radicals in polluted air, contaminated water, soil and many
more.
.One of the most sensitive techniques to observe radicals in everyday life
processes.
.Several orders of magnitude more sensitive than NMR (Nuclear Magnetic
Resonance) or optical chemical analysis techniques.
.Hydroxyl radical generation as a new method to monitor ambient Particulate
Matter(PM) composition that the Epidemiological studies have demonstrated.
Bioinorganic chemistry:
Practical examples:
.Bioinorganic transition metal compounds.
.Protective eects of a new stable, highly active SOD mimetic, M40401 in
splanchnic artery occlusion and reperfusion.
.Effects of Heavy Metal Ions on Living Tissues.
.Protective eects of a new stable, highly active SOD mimetic, M40401 in
splanchnic artery occlusion and reperfusion.
Food safety and quality:
.For
next door, multi-product, and large scale industrial food productions.
Practical examples:
.Radicals in coffee powder.
.Radicals in malt.
.Flavour stability in coffee.
.Beer/Wine/Beverage quality.
.Antioxidants factors evaluation in foods
.And many more.
Solid state physics:
.Standard technique to investigate, control and develop paramagnetic centers in
semiconductor materials.
.Fully digital bench top EPR spectrometer enables such measurements.
Advantages:
.Automatic angular dependence measurements by high precision goniometer
(accessory, option)
.Powerful software for spectra integration, noise- filtering, resolution
enhancement by deconvolution.
.Automatic line position determination for all measured angles, representation
of line positions as a function of angle.
.Signal channel with dynamics over 130db enables measurements of extremely small
signals up to extremely strong signals in the same spectrum.
.Absolutely no "sensitivity setting" or similar necessary before the
measurement.
.Up to 250,000 data- points per spectrum.
.Any magnetic field scan range between 10mT and 600mT, with 24bit (1:16.000.000)
resolution.
.Powerful "After measurement optimization" facilities of obtained data such as:
.Signal intensity representation.
.Noise suppression versus resolution optimization via digital filtering.
.Magnetic field modulation-phase optimization, I-Q- representation.
.Representation of first or second harmonic of magnetic field modulation.
.Microwave phase optimization (absorption/dispersion signal), I-Q-
representation
."DC-measurement”facility for the detection of signals with extremely long
relaxation times. .Rapid scan facility up to 1s for 300mT scan range,
measurement of rapid passage effects.
.Special "saturation behavior enhanced" measurement of EPR- signals, delivering
spectra where the signal intensity of lines is proportional to the degree of
saturation of the spin species belonging to the different lines (at a given
microwave power and temperature), that may greatly facilitate the analysis of
complex spectra with many overlapping lines do to different spin species present
at a time. .
Non saturated spin species exhibit no signal, whereas heavily saturated species
exhibit strong signals.
.Automatic precise cavity-Q measurement, by microwave synthesizer, automatic
detection of cavity aging effects.
.Integrated microwave frequency measurement.
For EDMR experiments:
.Magnetic field modulation scans from 1Hz to 30Hz, reference frequency output
for external lock-in detection.
.No problems with AFC- instabilities because of electric contacts or wires in
the cavity due to microwave setting by microwave synthesizer.
For LFA or similar experiments:
.Possibility (option) of zero-crossing magnetic field scans that may range from
-600mT to +600mT.
Beer and Beverage analysis:
.Flavor stability is a primary attribute of beer, beer mixed drinks, as well as
other (non-) alcoholic beverages.
.Flavor changes are attributed to oxidative reactions that are promoted by
radicals and suppressed by sample constituents with antioxidant properties.
.Accepted as being a highly effective and powerful tool to monitor oxidative
stability(flavor), a primary attribute of beer, beer mixed drinks, as well as
other (non-) alcoholic beverages. .Using spin trapping reagents, feasible to
detect free radicals in beer and beverages.
.Compact and easy-to-use, ideal for quality assurance in breweries and beverage
producing industries.
.Helps to determine key parameters such as the Endogenous Antioxidative
Potential (EAP/Lag-Time).
.Ideal tool for the evaluation of the beer's oxidative flavor stability and
shelf time through the determination of the Endogenous Antioxidative Potential
(EAP) and the Beverage Antioxidative index (BAX).
.With the novel Autosampler unit allows a fully automated measurement of these
values, enabling effective handling of large sample amounts with minimal
operator handling.
.Comes along with the professional software, offering a user friendly platform
for result calculation and documentation.
Facts:
.Fully automated handling of samples. .Up to 30 samples per analysis.
.Temperature control up to 70°C.
.Automatic EAP and BAX calculation. .State-of-the-art and user friendly
software.
.Comprehensive software both values (EAP and BAX) can be measured fully
automated and with high precision.
ESRStudio Software:
.Easily start programs and view complex evaluation results standard user.
.All necessary features and result analysis tools required for all advanced
scientific projects for more advanced user.
.More convenient and less time consuming with the new automated report
generation feature, for Day-to-day research works.
.Advanced tools like peak picking algorithms, automated angular dependent
evaluation or g-factor evaluation, accelerate necessary processing steps and
supports the user in finding perfect processing parameters.
.The fully digital spectrometer concept allows high flexibility features i.e.
rapid scan, modulation sweep and microwave power sweep are within the standard
configuration.
.Supports several file formats for import, standard export is XML, which are
structured ASCII and can be used for further evaluation.
.Import functions allow evaluations of already existing measurements. Key
advantages: .Most advanced and user friendly EPR/ESR operating/evaluation
software available.
.User/application based customization.
.Advanced scientific capability. .Workflow for automated spectrum evaluation.
.Automated lab report generation. .Remote access - access your EPR/ESR
spectrometer from anywhere in the world via. internet.
.Online training and Technical support. .Versatile optimization of parameters
(after measurement) such as: gain, signal amplitude, phase of magnetic field
modulation (to account for different spin relaxation times), optimisation of
Signal to Noise ratio versus resolution by digital filters. Connectivity:
.Connected to a computer via Ethernet that allows flexible installation and
comfortable measurement & control arrangement using short cables.
.A preconfigured encrypted remote access allows the user to monitor and control
the measurement process from any computer within the network, and if desired,
from anywhere in the world via.the Internet.
.Allows Instruments manufacturer to access the machine (with customer's
permission) to provide online training and remote technical support within 24
Hrs.
EasySpin MATLAB Tool Box
.A
MATLAB toolbox for simulating and fitting a wide range of Electron Paramagnetic
Resonance (EPR) spectra. It supplements the numerical and visualization power of
MATLAB with the best computational methods devised by EPR spectroscopists.
.Runs on Windows, Linux and Mac, and is available free of charge.
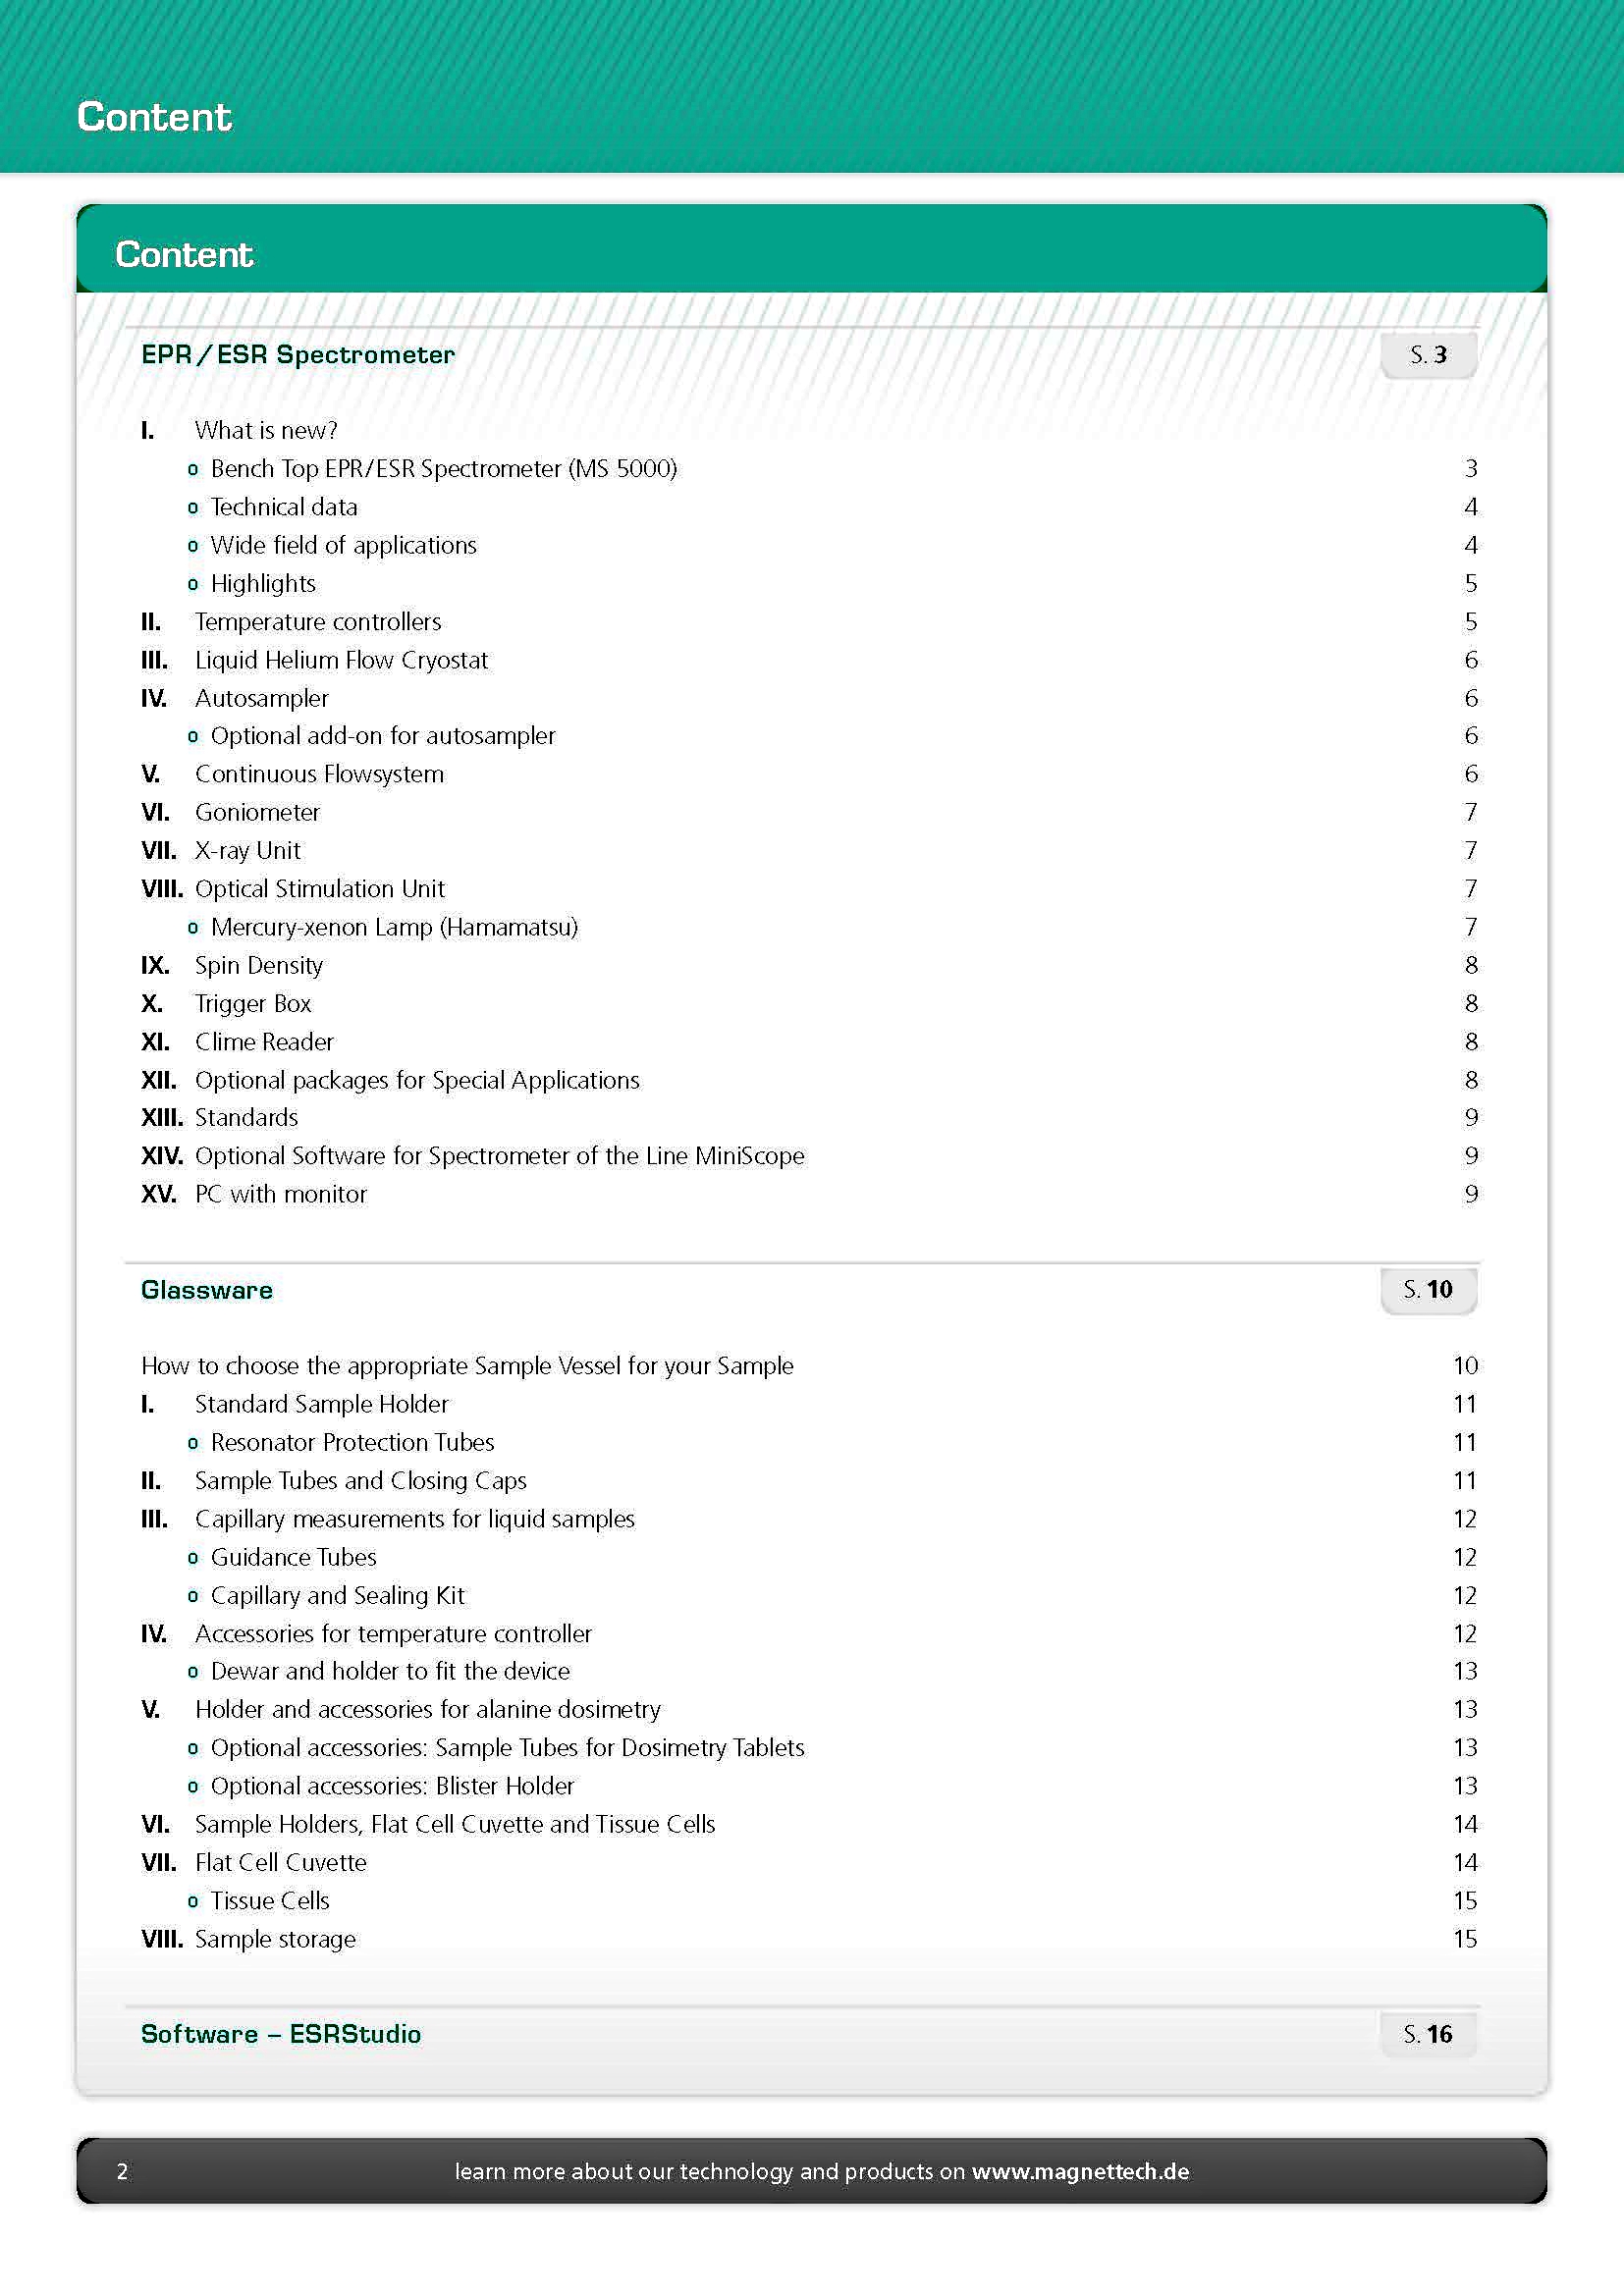
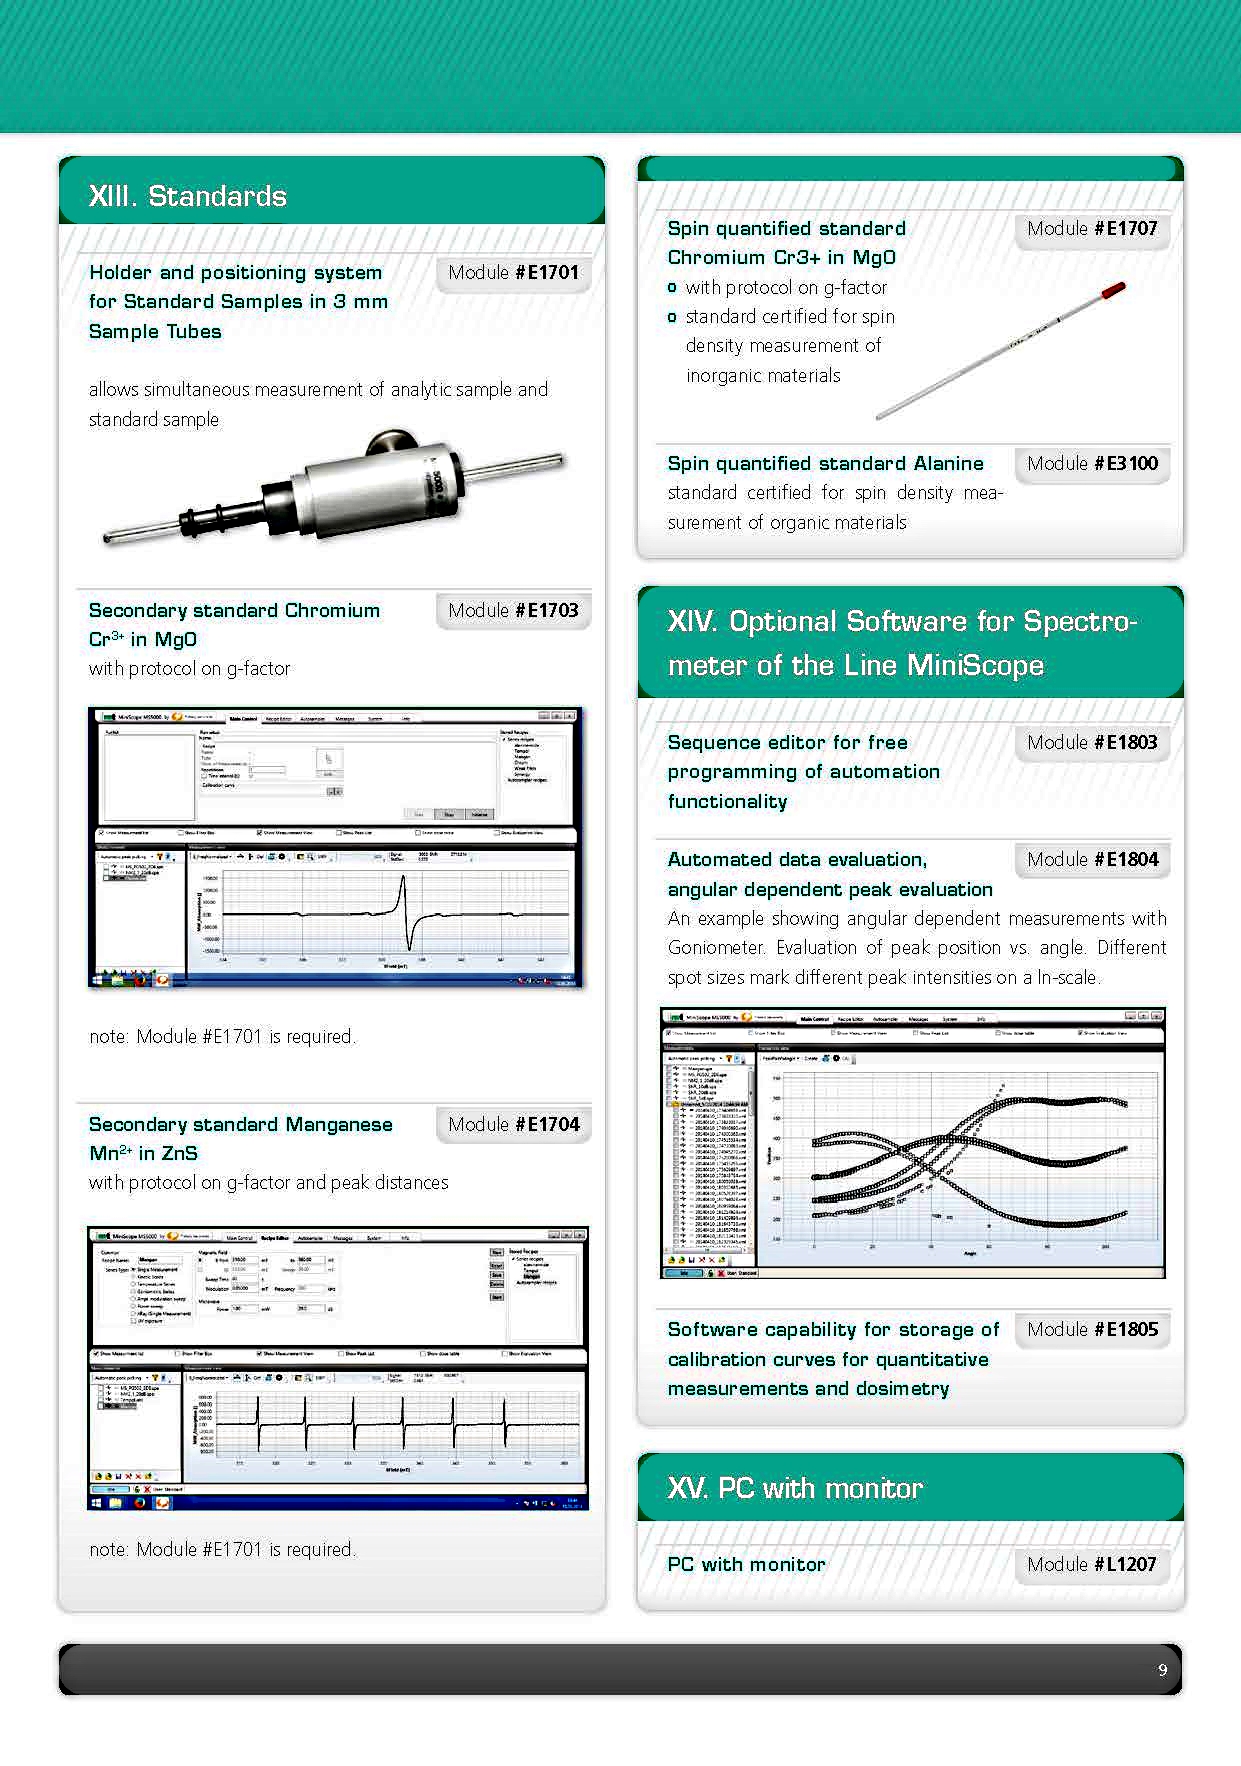
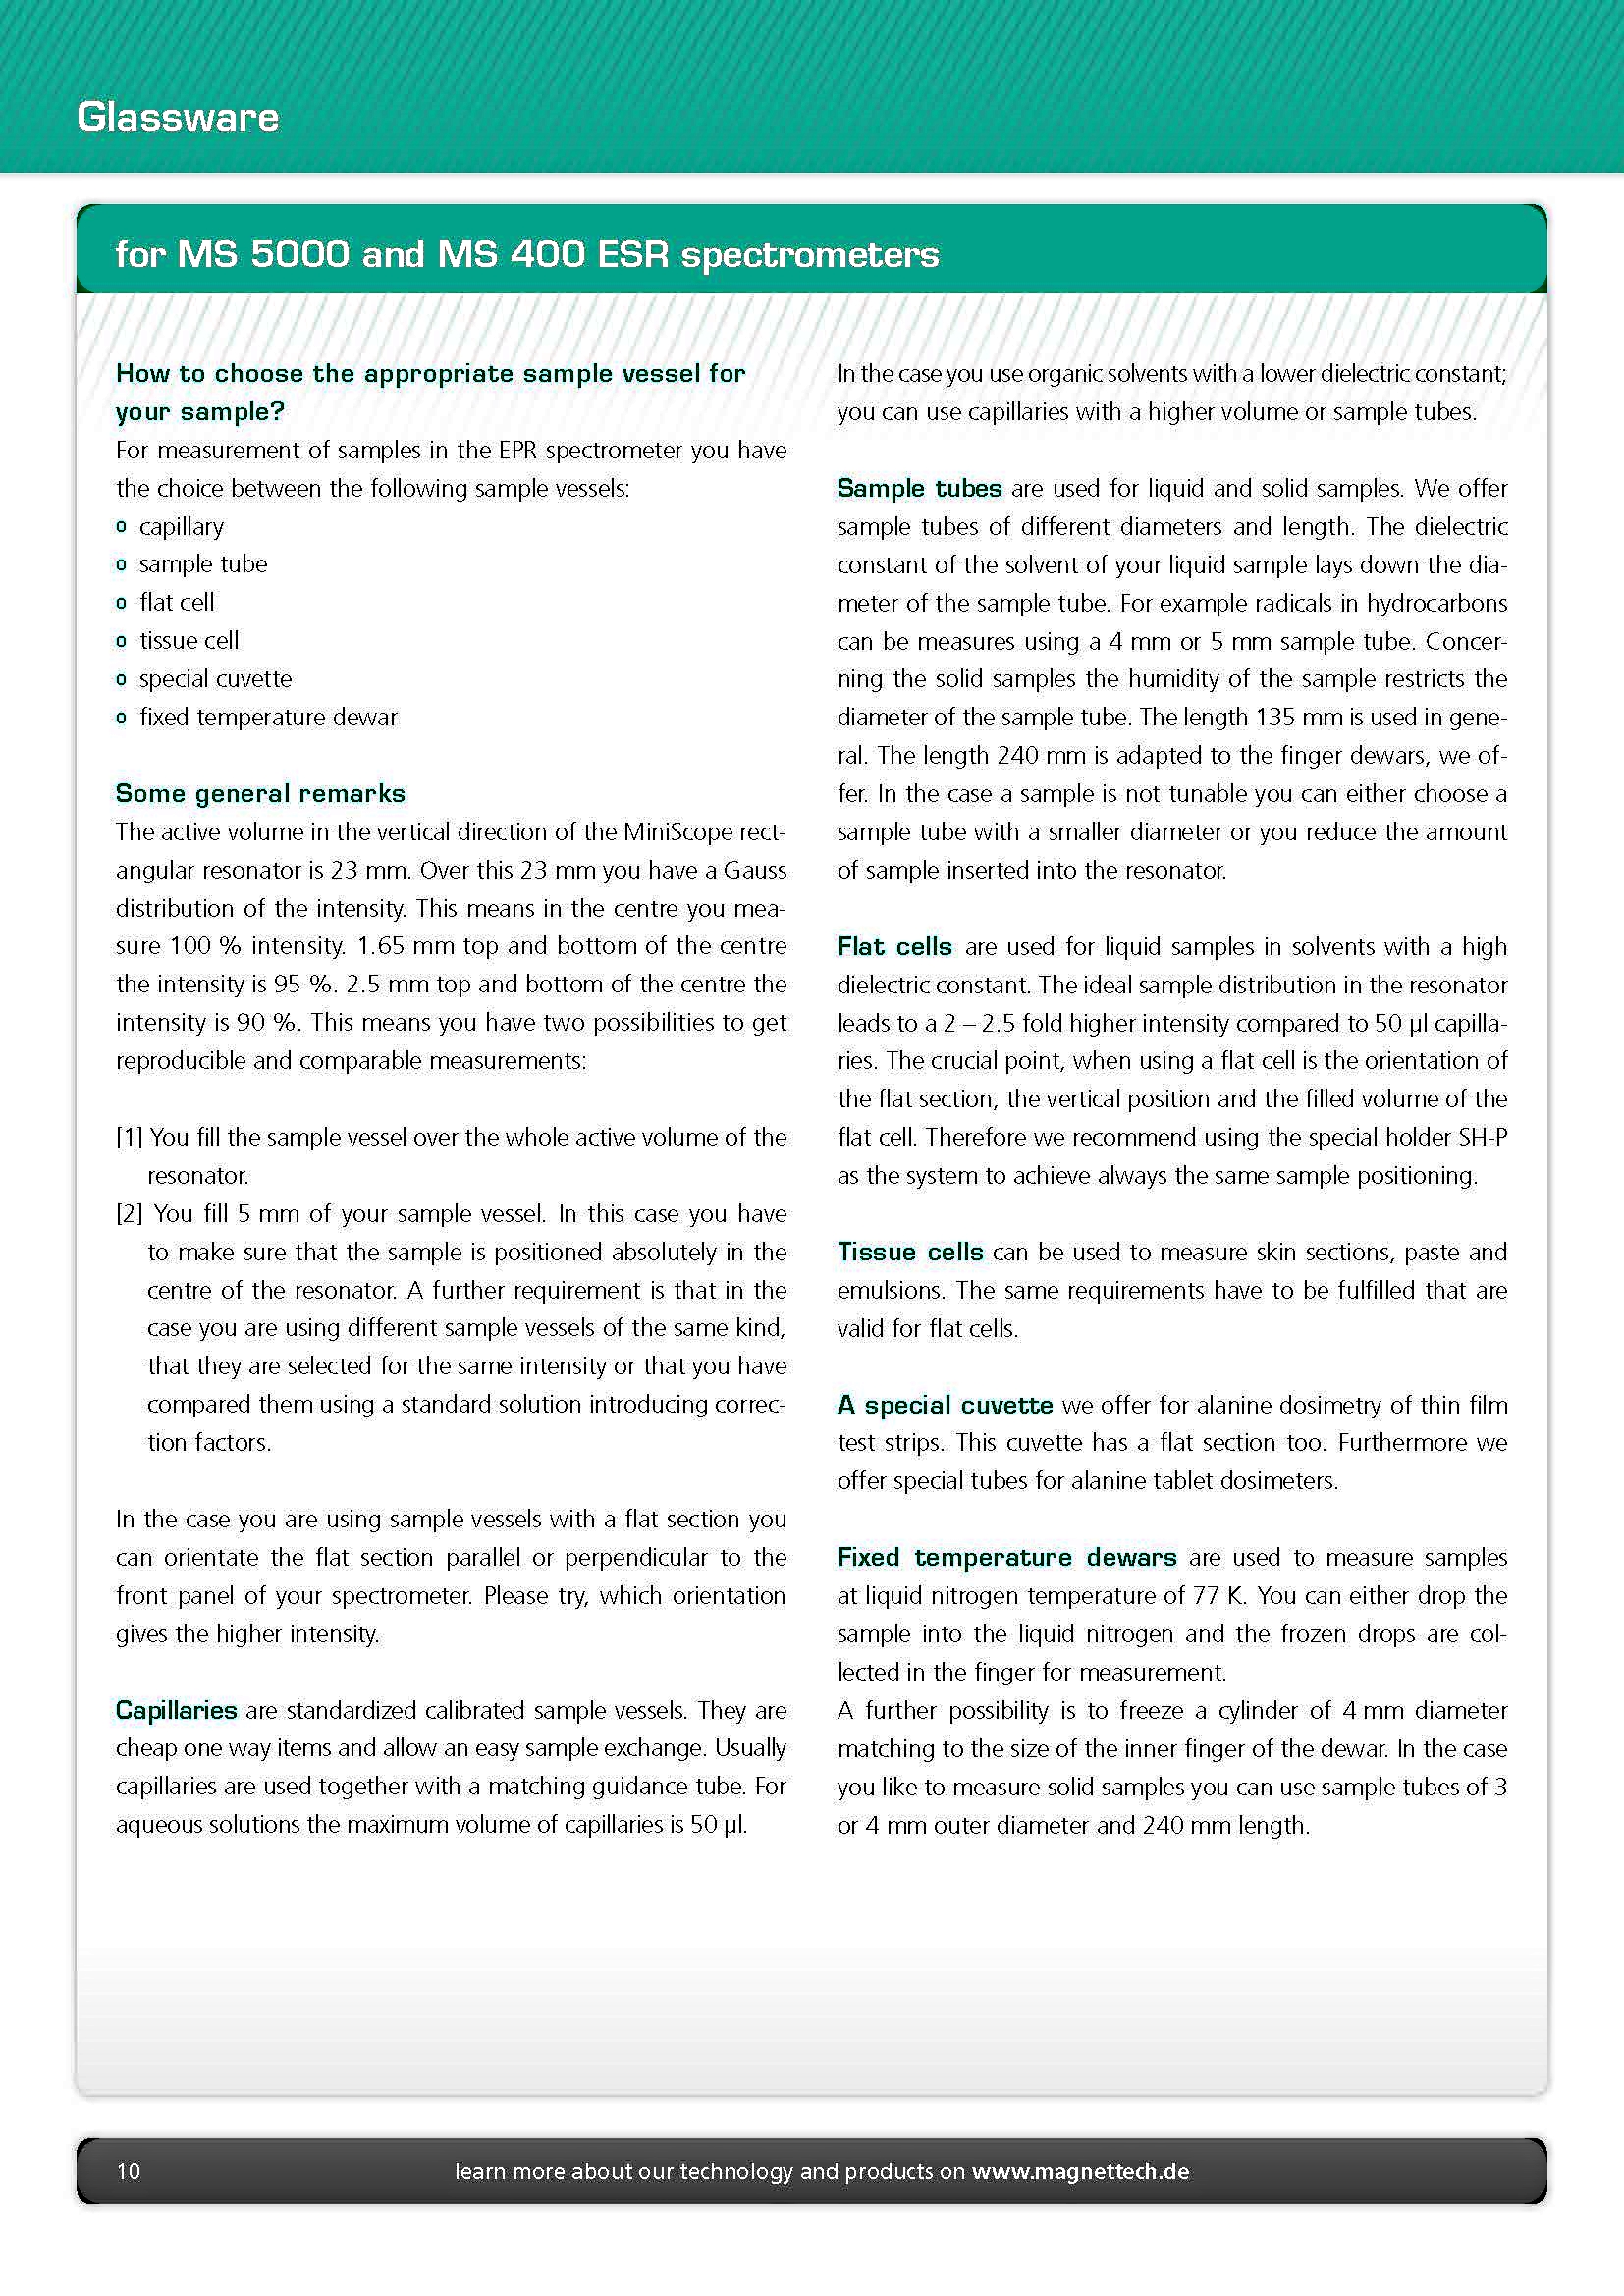
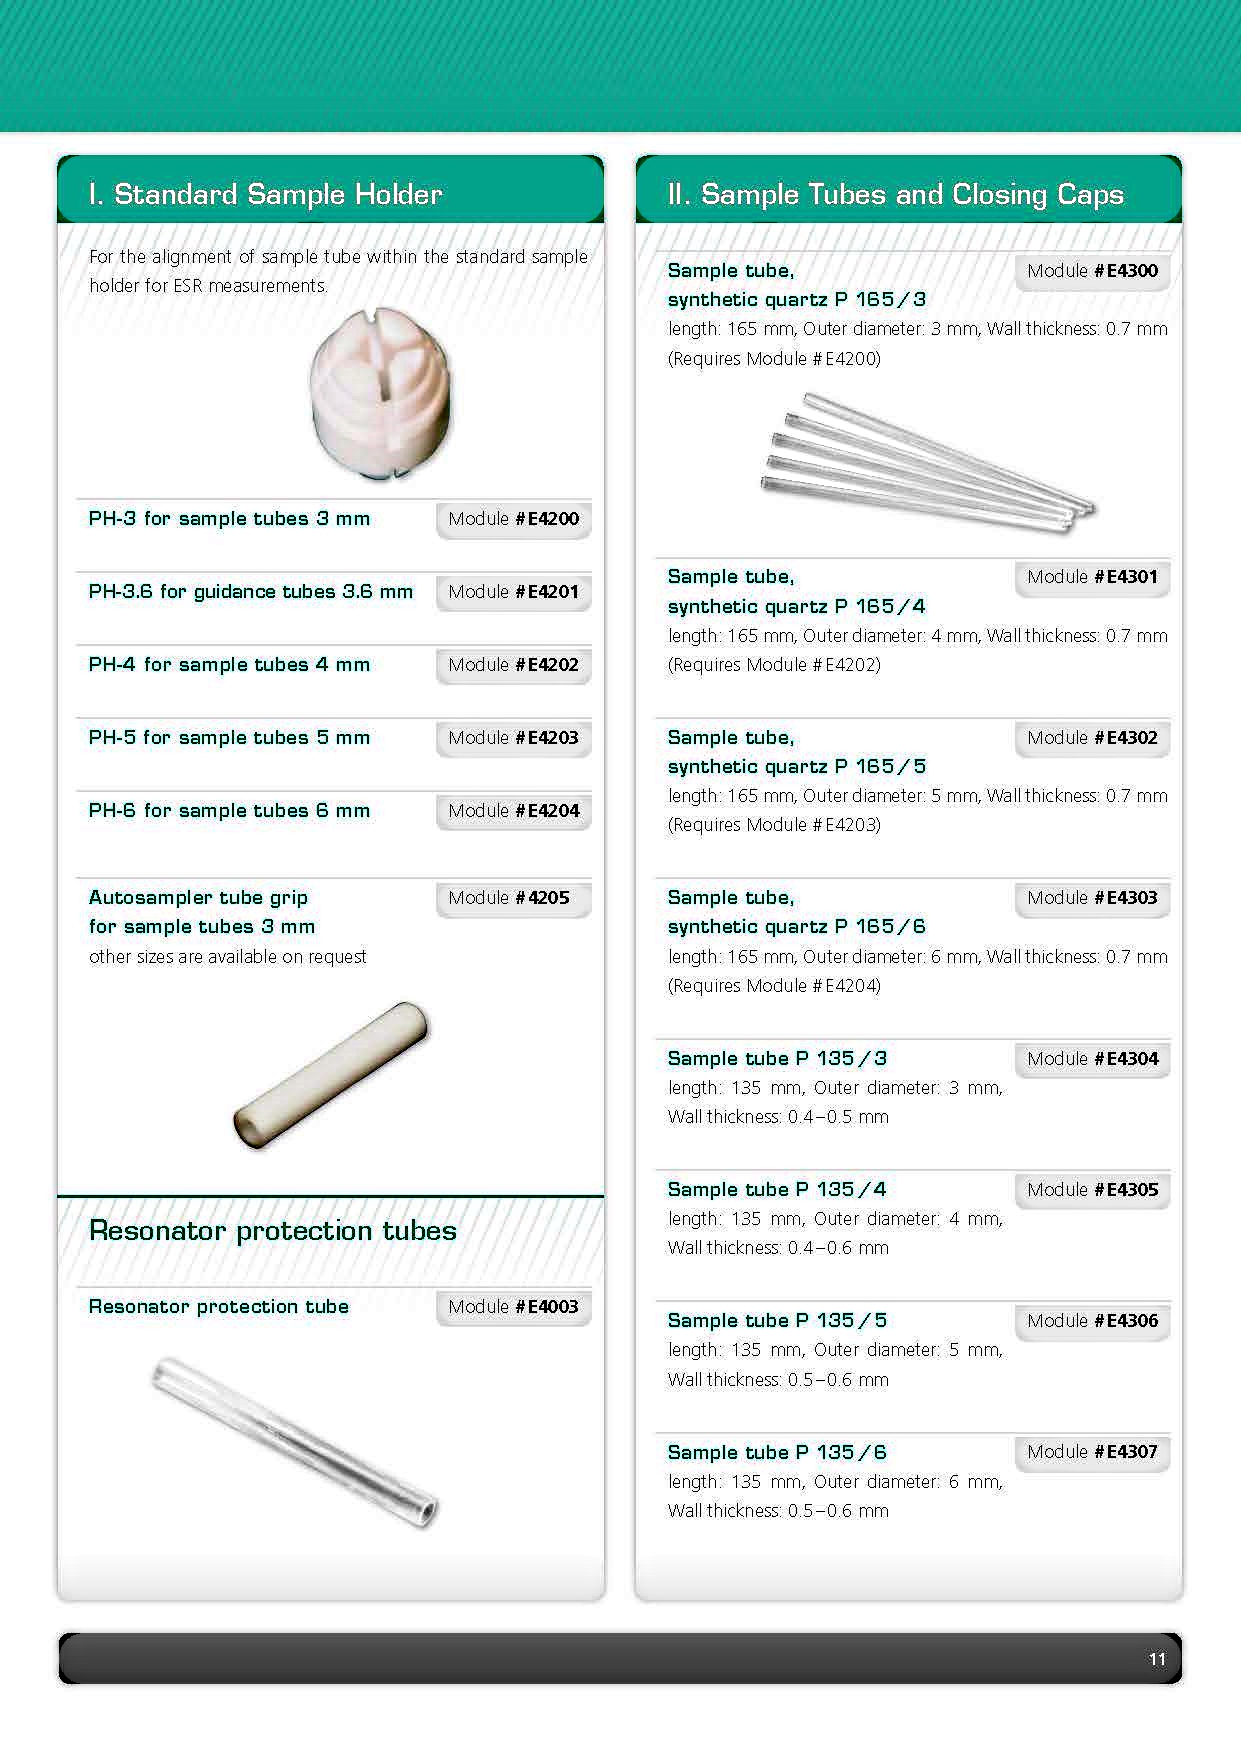
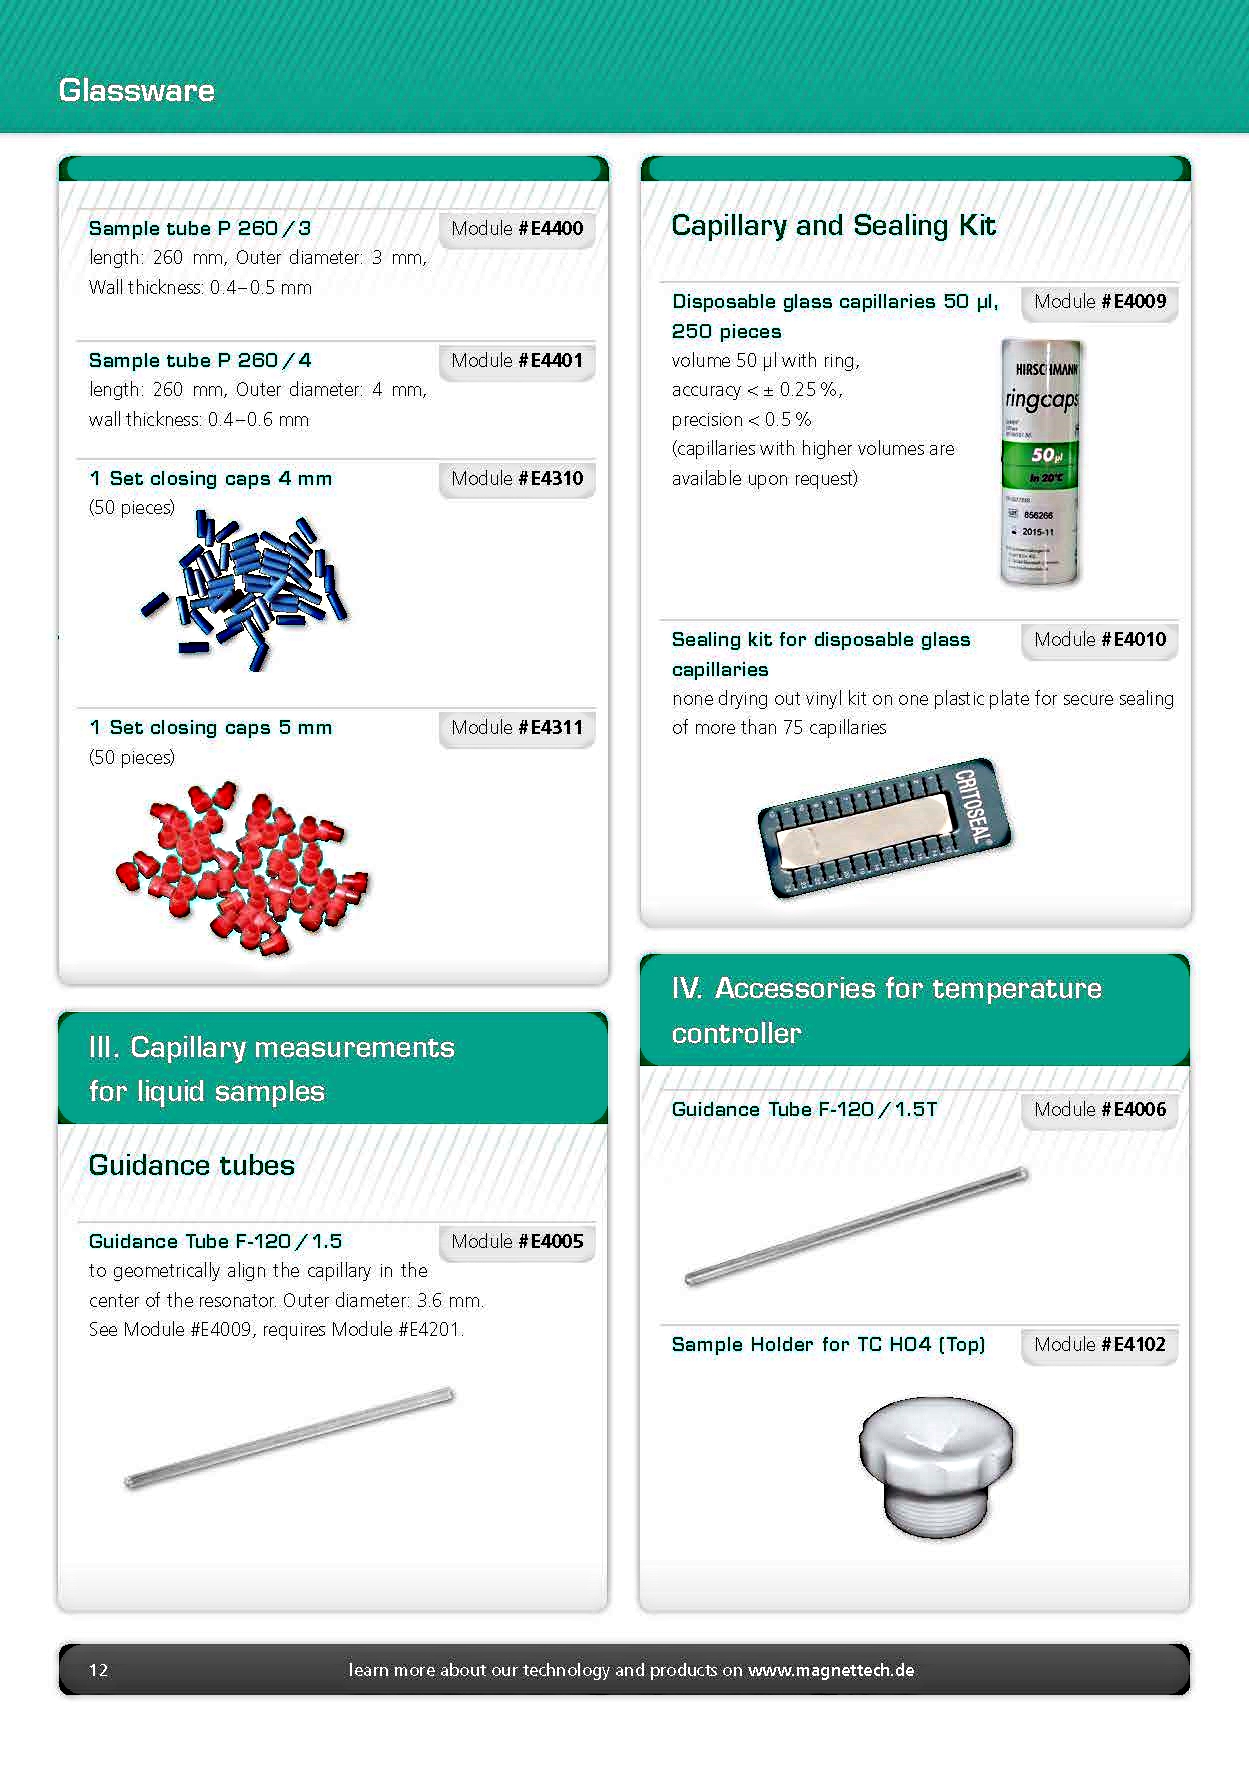
Catalogue for EPR-Spectrometer, Accessories & Glassware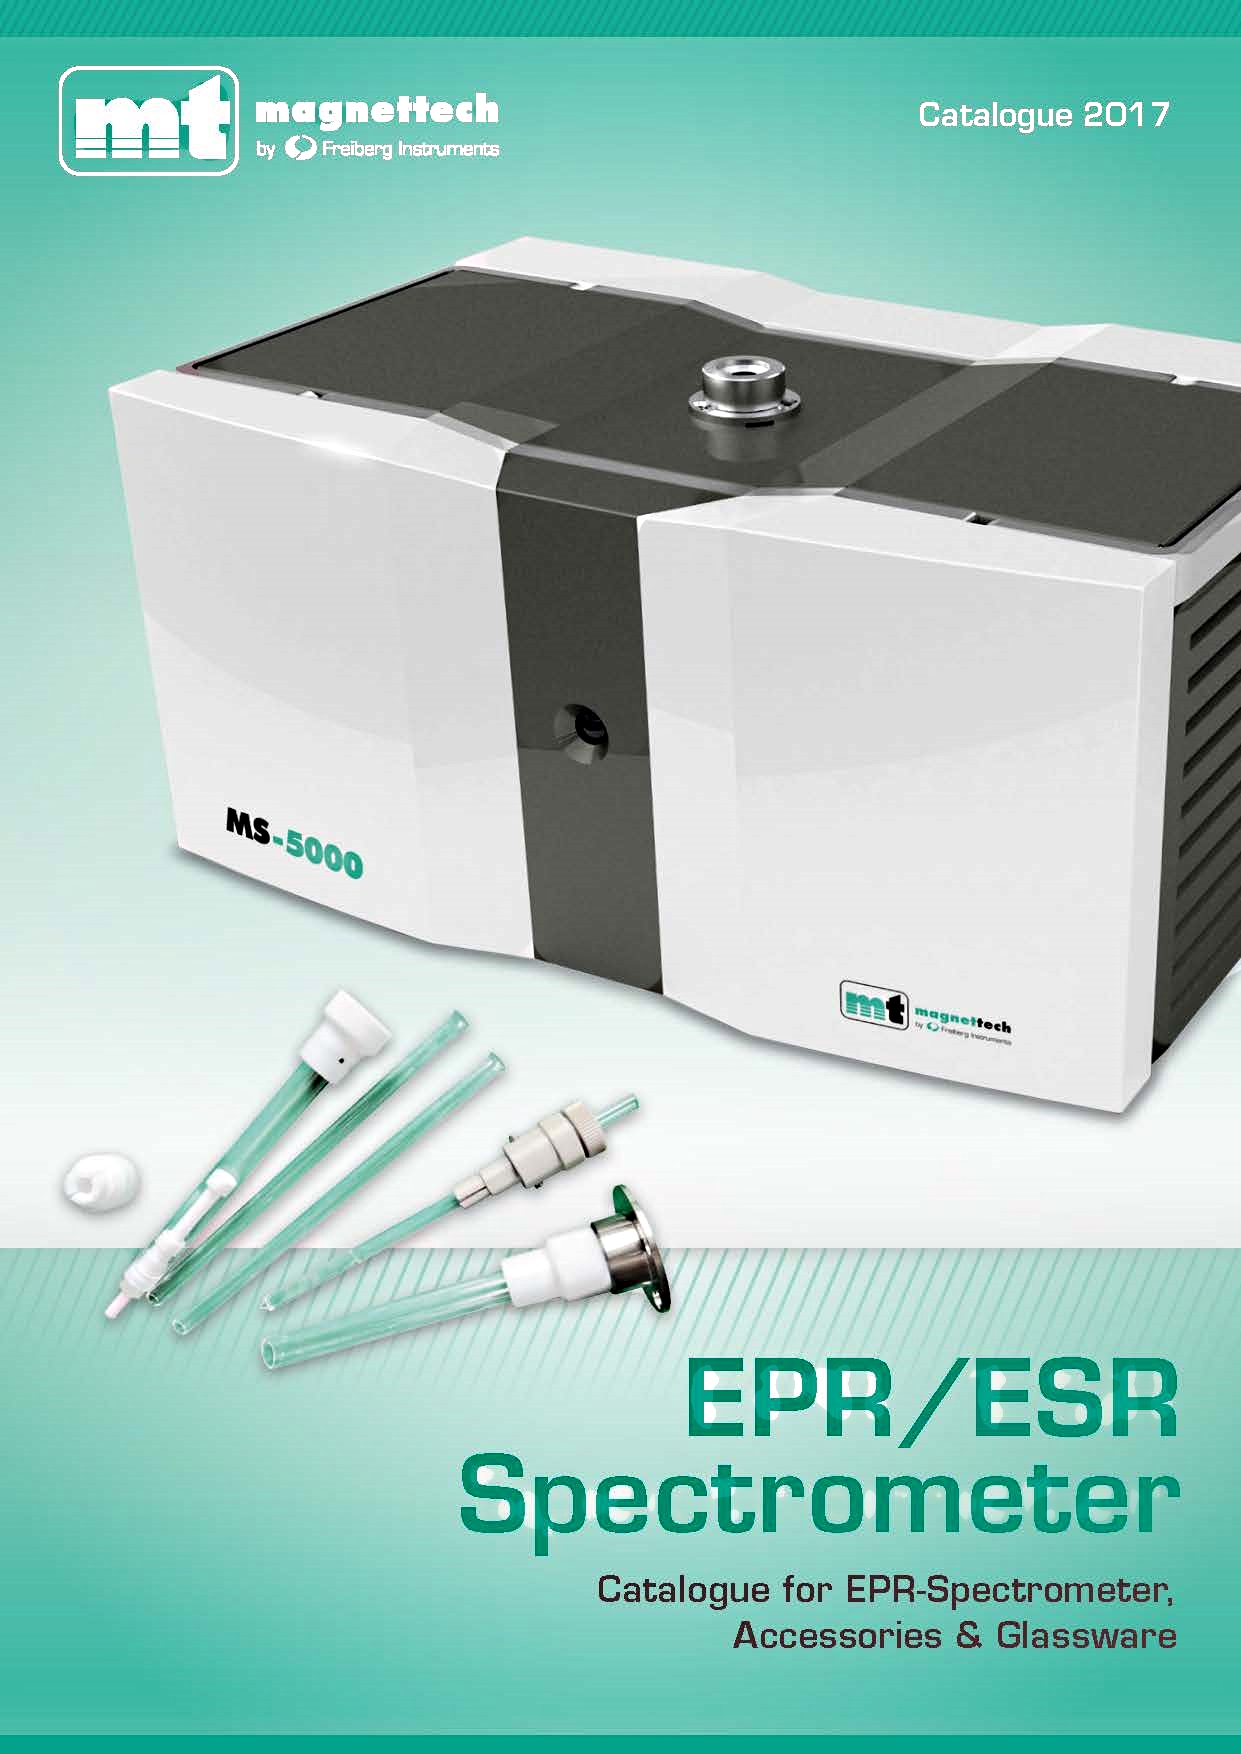
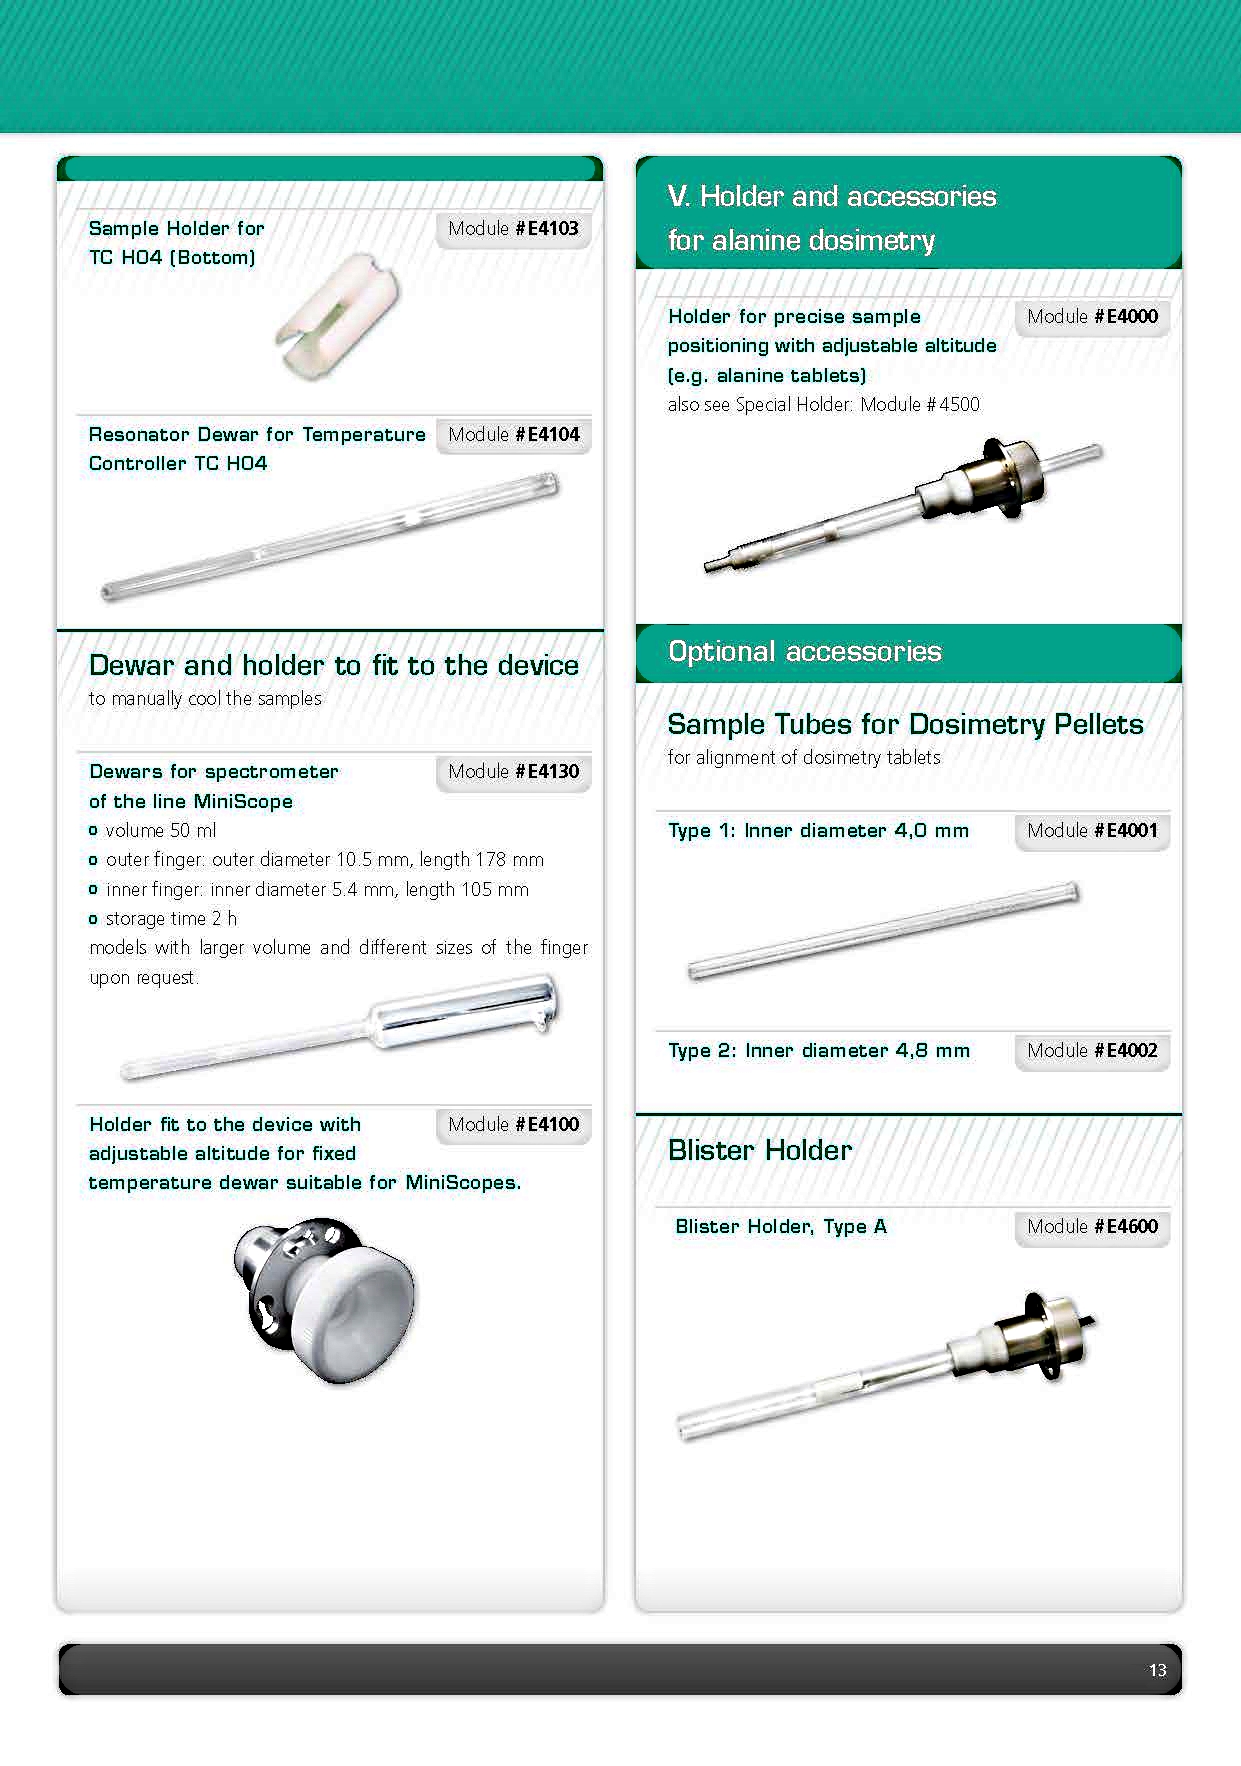

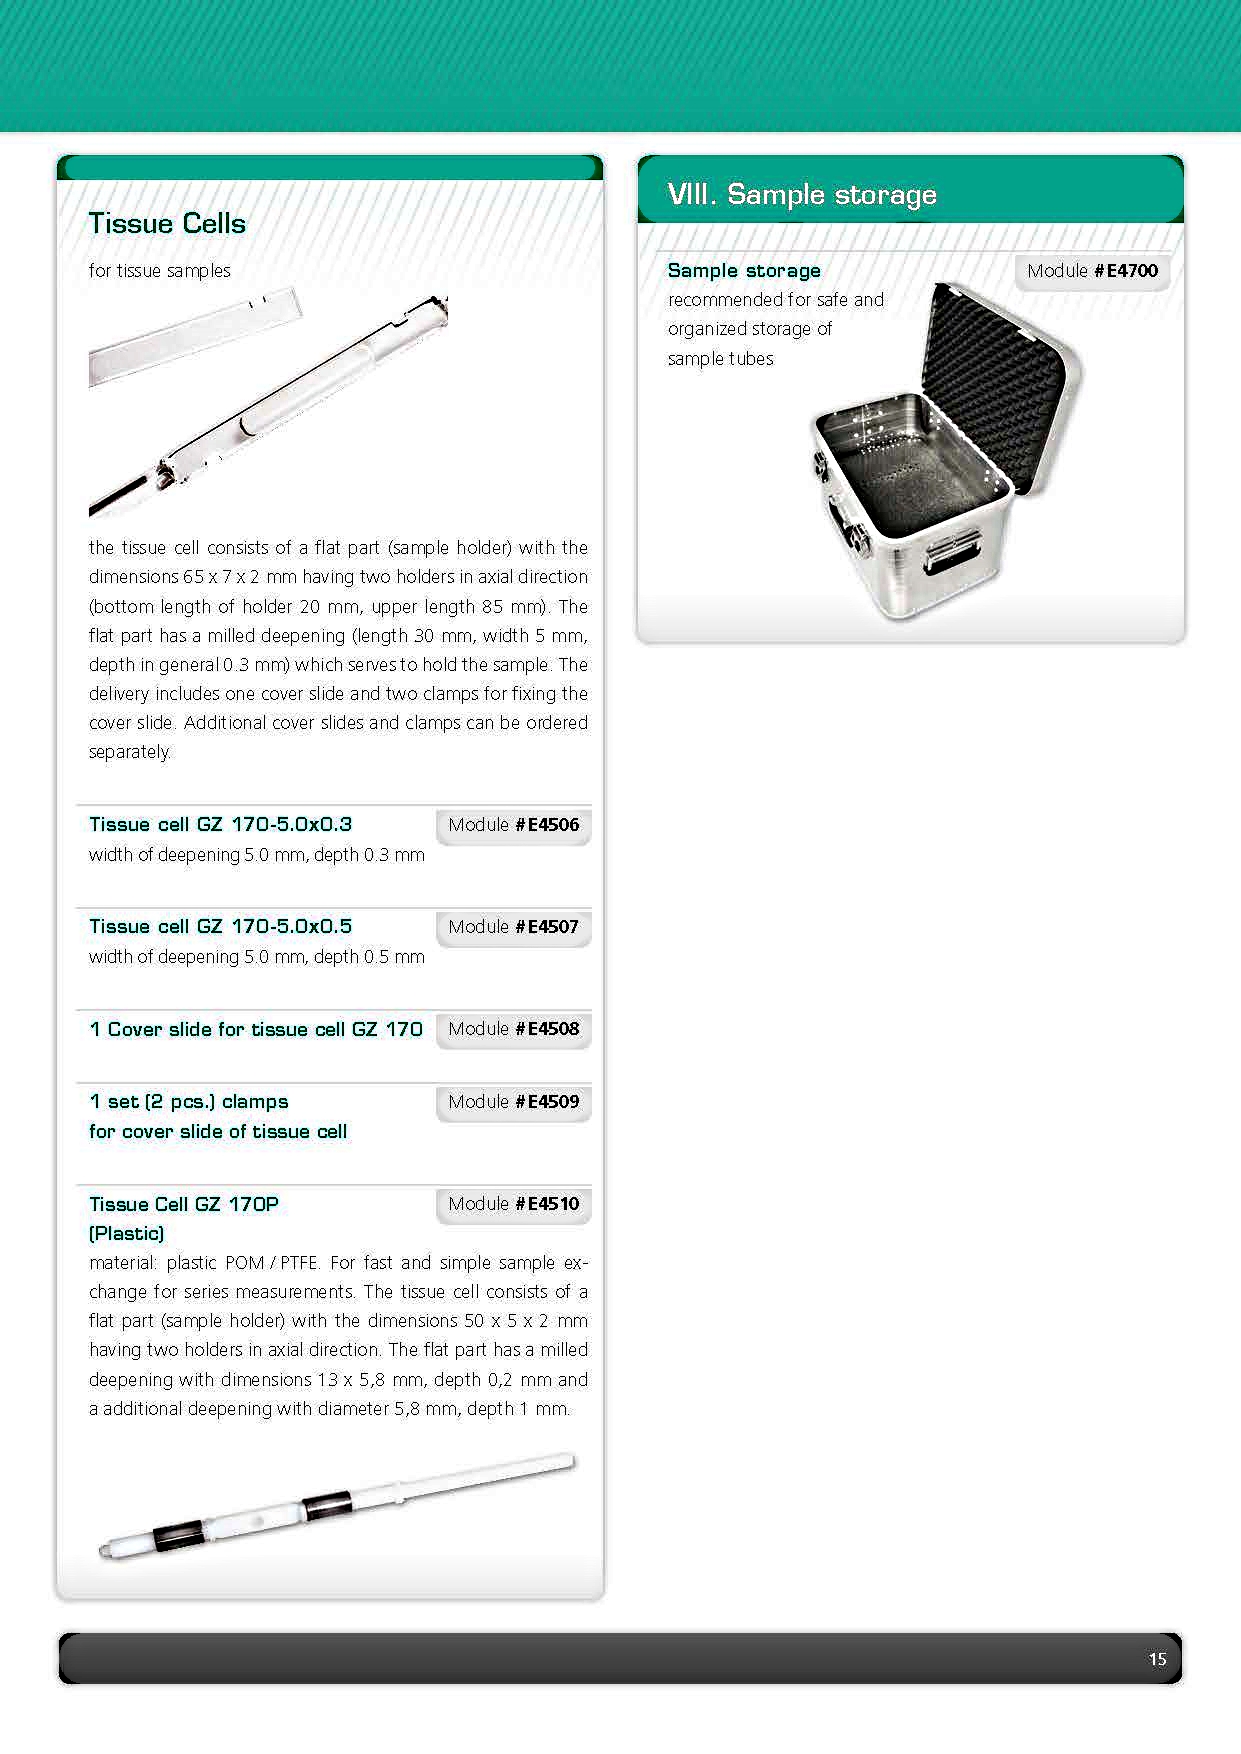
|
|
|